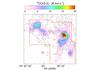
Fig. 1
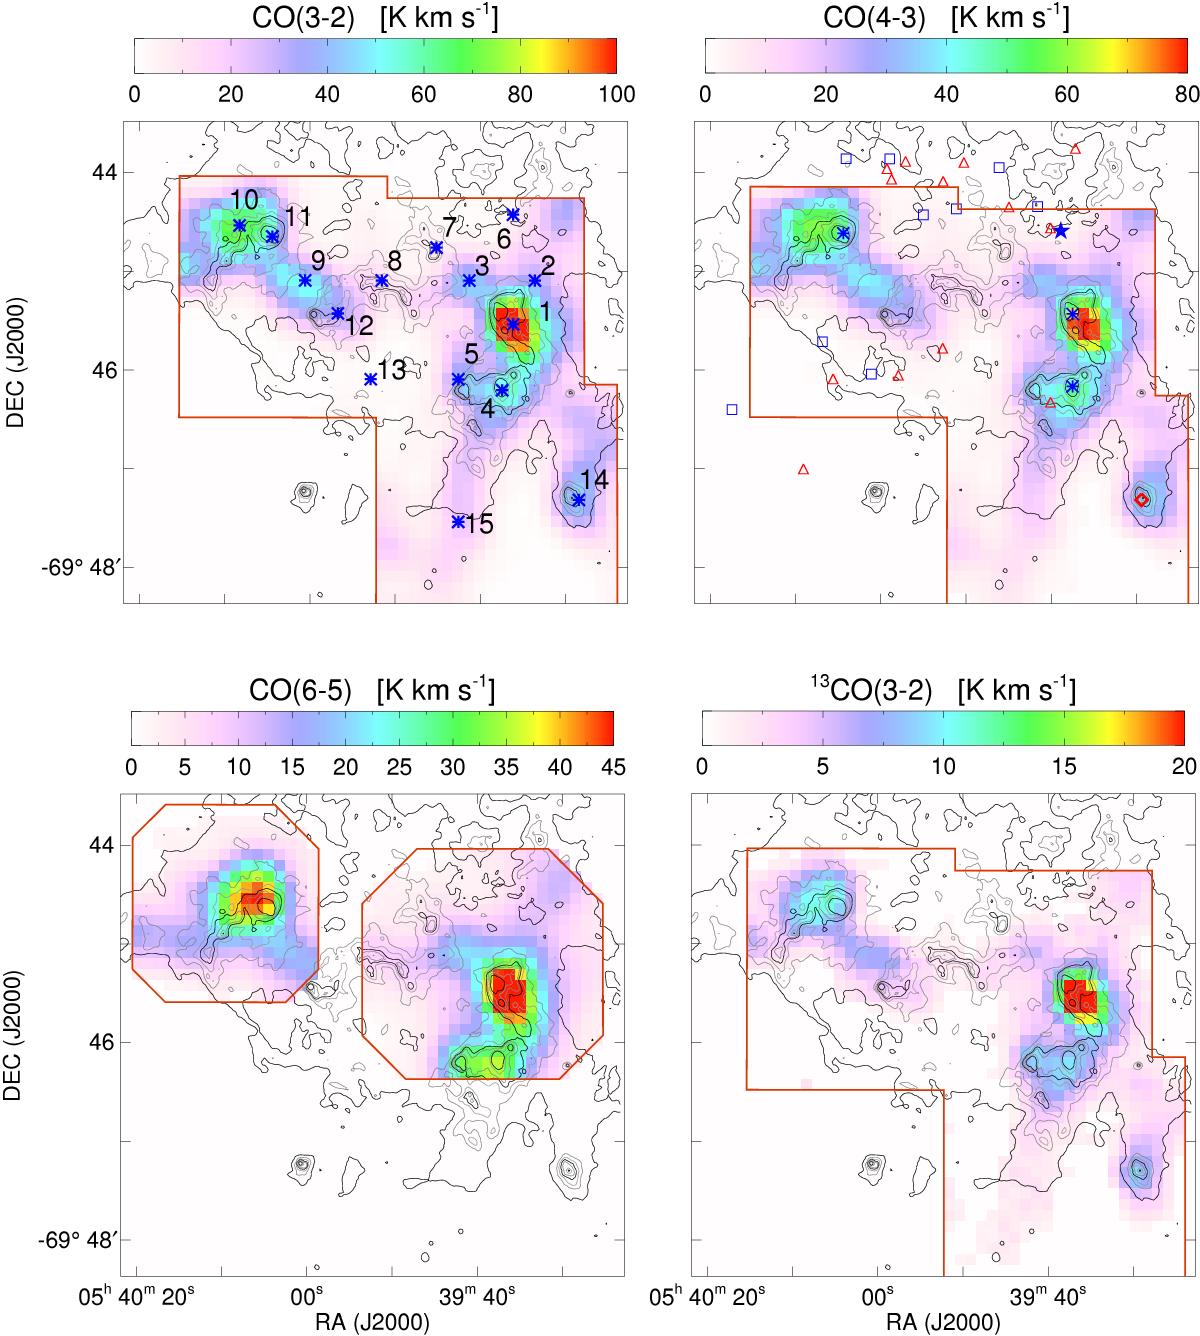
Integrated (220 to 250 km s-1) intensity maps (colors, 20′′ resolution) overlayed with the contours of IRAC 8 μm. The last (eighth) panel shows a three-color image composed of CO(3–2) (blue), [C i] 3P1–3P0 (green), and [C ii] (red). The red lines outline the observed area. Blue asterisks in the CO(3–2) and [C ii] maps mark the positions whose spectra are shown in Fig. 2. Open blue squares and red triangles in the CO(4–3) map show the position of stars with a spectral type of O7 or earlier and O7 to B1, respectively, from Fariña et al. (2009), the filled blue star marks the position of LMC X-1, the blue asterisks are compact H ii regions (Indebetouw et al. 2004), and the red diamond marks the position of an H2O maser (Lazendic et al. 2002).
Current usage metrics show cumulative count of Article Views (full-text article views including HTML views, PDF and ePub downloads, according to the available data) and Abstracts Views on Vision4Press platform.
Data correspond to usage on the plateform after 2015. The current usage metrics is available 48-96 hours after online publication and is updated daily on week days.
Initial download of the metrics may take a while.