| Issue |
A&A
Volume 580, August 2015
|
|
|---|---|---|
| Article Number | A71 | |
| Number of page(s) | 6 | |
| Section | Extragalactic astronomy | |
| DOI | https://doi.org/10.1051/0004-6361/201425384 | |
| Published online | 05 August 2015 | |
Swift-XRT six-year monitoring of the ultraluminous X-ray source M33 X-8
INAF−Istituto di Astrofisica Spaziale e Fisica Cosmica di Palermo, via U. La Malfa 153, 90146 Palermo, Italy
e-mail: This email address is being protected from spambots. You need JavaScript enabled to view it.
Received: 21 November 2014
Accepted: 27 June 2015
Abstract
Context. The long-term evolution of ultraluminous X-ray sources (ULX) with their spectral and luminosity variations in time give important clues on the nature of ULX and on the accretion process that powers them.
Aims. We report here the results of a Swift-XRT six-year monitoring campaign of the closest example of a persistent ULX, M33 X-8, that extends the monitoring of this source in the soft X-rays to 16 years. The luminosity of this source is a few 1039 erg s-1, marking the faint end of the ULX luminosity function.
Methods. We analyzed the set of 15 observations collected during the Swift monitoring. We searched for differences in the spectral parameters at different observing epochs, adopting several models commonly used to fit the X-ray spectra of ULX.
Results. The source exhibits flux variations of about 30%. No significant spectral variations are observed during the monitoring. The average 0.5−10 keV spectrum can be well described by a thermal model, either in the form of a slim disk, or as a combination of a Comptonized corona and a standard accretion disk.
Key words: stars: black holes / X-rays: individuals: M 33 X-8
© ESO, 2015
1. Introduction
Ultraluminous X-ray sources (ULX) are point-like, off-nuclear objects observed in many nearby galaxies to have isotropic luminosity between ~1039 and ~1041 erg s-1 (e.g., Fabbiano 1989; Swartz et al. 2011). There are several hypotheses to explain their nature (they may indeed form a heterogenous class of sources): if the emission is isotropic, then it exceeds the Eddington limit for a stellar mass black hole and could indicate the presence of an intermediate-mass black hole (IMBH, with MBH ~ 100−1000 M⊙, e.g., Colbert & Mushotzky 1999; Sutton et al. 2012), whose existence may be related either to Population III stars (Madau & Rees 2001; Fryer et al. 2001), to the capture and stripping of the nuclei of satellite galaxies in hierarchical merging (King & Dehnen 2005), or to repeated mergers of stellar mass black holes in globular clusters (Miller & Hamilton 2002). On the other hand, the emission could be either relativistically beamed (for example, Begelman et al. 2006, investigated the analogy of the Galactic microquasar SS433 with the ULX class), or, more likely, geometrically beamed (i.e., collimated into a wind-produced funnel, see, e.g., King et al. 2001; King 2009), or we could be seeing a super-Eddington ultraluminous accretion state (Gladstone et al. 2009 and reference therein): all these mechanisms would allow for more common stellar mass black holes (with MBH ≲ 100 M⊙). The recent discovery of a 1.37 s pulsation in the ULX M82-X2 (Bachetti et al. 2014) has set the case for the presence of neutron stars in the ULX population (King 2009), triggering a renewed interest in this still challenging debate.
A strong X-ray emission (which is persistent in most cases, although there are also some remarkable example of transient ULXs, see, e.g., Middleton et al. 2012; Soria et al. 2015) is ubiquitous in these sources, while only a few of them are detected at other wavelenghts. Thus, the main tools for gaining knowledge on their nature are the analysis of their X-ray spectra to identify the main physical processes that power them, and the study of their light curves to understand how these processes are correlated with each other and with the luminosity of the sources. Several studies, based both on samples of ULXs (e.g., Gladstone et al. 2009; Stobbart et al. 2006) and on the monitoring of single sources (e.g., Kong et al. 2010; Feng & Kaaret 2010; Grisé et al. 2010) have been carried on in this direction, showing that in most cases the emission can be described with a combination of a thermal disk-like component plus a (broken) power-law-like component (see also Feng & Soria 2011, for a review). The relative contribution of the two components (if both are present) as well as their temperature and slope may vary substantially from source to source. The observed phenomenology that presents several evident inconsistencies with that of Galactic black hole (GBH) binaries (e.g., the persistence in a bright state of most ULX with smooth spectral variations, as opposed to the transient behavior of accreting GBHs, the frequent presence of a soft thermal excess below 2 keV, a spectral curvature at ~3−5 keV, see, e.g., Gladstone et al. 2009; Soria 2011; Vierdayanti et al. 2010; Middleton et al. 2015) have been combined in a model that describes the ULXs as accreting black holes whose emission is powered by supercritical accretion. In this model the disk appears as a standard disk (Shakura & Sunyaev 1973) at large radii and emerges as a slim disk in the inner region, providing a moderate super-Eddington luminosity (Abramowicz et al. 1988; Watarai et al. 2000; Ebisawa et al. 2003). The accreting mass in excess of the critical Eddington limit may be ejected through a collimated wind, resulting in a geometrical beaming. This wind is transparent at small radii and leaves the innermost (hot) region of the disk exposed to the viewer (Poutanen et al. 2007; Middleton et al. 2015). At larger viewing angles, the optically thick wind hides the innermost regions of the disk, resulting in an apparently lower inner temperature. A wide spectrum of black hole masses and/or different viewing angles (as discussed, e.g., in Middleton et al. 2015; Sutton et al. 2013) may thus explain the observed variegated phenomenology.
M33 X-8 (Long et al. 1981; Trinchieri et al. 1988), located at a distance of ~820 kpc (Freedman et al. 2001), is the closest example of persistent ULX. Its position is roughly coincident with the center of its host galaxy (Fig. 1), but the upper limit derived by Gebhardt et al. (2001) on the mass of the nucleus of M33 (1500 M⊙) and the detection of a ~106 d periodical modulation (Dubus et al. 1997) rules out the possibility that the source is a low-luminosity AGN. On the other hand, no optical counterpart could be identified because of the extreme crowding of the field. Its X-ray luminosity of a few 1039 erg s-1 makes it belong to the faint end of the ULX luminosity distribution. Its flux, persistently above 10-11 erg cm-2 s-1 in the X-ray band, allows very detailed studies of its spectrum and how it evolves in time (see Foschini et al. 2006; Weng et al. 2009; Middleton et al. 2011; Isobe et al. 2012).
In this paper we present the results of an observing campaign on M33 X-8 that was performed with Swift-XRT (Gehrels et al. 2004). The paper is organized as follows. Section 2 describes the data and their reduction, Sect. 3 reports on the results of the spectral analysis, and in Sect. 4 we discuss the results and draw our conclusions.
2. Observations and data reduction
Swift-XRT (Burrows et al. 2004) observed the central region of M33 fifteen times between December 2007 and June 2013, with two different campaigns that targeted M33 X-8 and Nova2010-10a, respectively. In the latter group of observations M33 X-8 is ~5.5 arcmin off-axis. The details on all the observations are reported in Table 1. Figure 1 shows the XRT image of the source obtained after integrating over all the observations, with a total exposure time of ~115 ks. All the observations are in photon-counting observing mode (Hill et al. 2004). The data were processed with standard procedures (xrtpipeline) using the ftools in the heasoft package (v 6.16), and the products were extracted adopting a grade filtering of 0−12. The source count rate in all the observations varies in a range where we may expect some photon pile-up. For the spectral analysis, we therefore checked each observation for the presence of pile-up by comparing the source radial profile with the expected PSF profile (Moretti et al. 2005) and excluding the inner region where the two curves diverge1. In observation 10 the source is crossed by a hot column through its centroid, therefore we did not use this observation for the spectral analysis. The background was extracted for all the observations from a circular region 50 pixels in radius far from other bright point sources in the field. The ancillary response files for each spectrum were generated with xrtmkarf, and we used the spectral redistribution matrix v0132. We also built the average spectrum summing the spectra from the single observations (using mathpha); the relevant ancillary files were combined using addarf, weighting them according to the exposure time of the corresponding spectra.
To allow the use of χ2 statistics, all the spectra were rebinned to have at least 20 counts per energy bin. The spectral analysis was performed using xspec v.12.5.
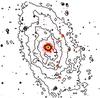 |
Fig. 1 X-ray image of M33 obtained by cumulating all the Swift-XRT observations, with the optical contour levels superimposed, showing the position of M33 X-8 coincident with the optical center of the galaxy. Contour levels are derived from the DSS image3 and have a linear spacing in intensity with a constant ratio of 0.13 beetween consecutive levels and the faintest level corresponding to 10% of the maximum intensity in the image. |
XRT observations log.
3. Analysis and results
As a first step, we simultaneously fit the fourteen spectra obtained from the single observations, constraining the model parameters to assume the same value for all the spectra, except for the model normalization (parametrized through a multiplicative constant fixed to 1 for the faintest spectrum, i.e., Obs 15, and left free to vary for the others).
We tested two single-component models: a power law that has been used to describe ULXs in their hard state (see e.g. Winter et al. 2006; however, see also Gladstone et al. 2009; Bachetti et al. 2013; Walton et al. 2014, which illustrates the limits of this model in the presence of high statistics data), and a modified disk model (diskpbb in xspec), that is, an accretion disk model where a parameter (p) describes the temperature radial dependance as T ∝ R− p: a value of 0.75 indicate a standard disk, expected for sources in a pure thermal state (Makishima et al. 2000; Winter et al. 2006), while a value p = 0.5 describes a slim disk, where advective energy transport dominates radiative cooling (see, e.g., Watarai et al. 2000). An absorption component (phabs, with abundances from Anders & Grevesse 1989) was included in each of the test models, with the absorbing column fixed to the Galactic line-of-sight value of 1.1 × 1021 cm-2 (Kalberla et al. 2005). A second absorption component was included as a free parameter to describe any intrinsic absorption, if present (i.e., the absorption in each model is described as phabsGal×phabslocal, where the former is fixed to the Galactic line-of-sight value and the latter is a free fit parameter for all the tested models).
The power-law model yielded a poor fit, with apparent trends in the residuals in all the datasets (see also the average spectrum residuals in Fig. 3, panel b). Even after releasing the power-law indices and the intrinsic absorbing column, allowing them to vary independently for each data set, the fit did not generally improve, showing no significant change in the residuals pattern, with χ2 = 1649.7/1457 d.o.f.
The diskpbb model was first tested by leaving the inner disk temperature as a free parameter with a common value for all the datasets, while the temperature radial dependence was constrained to be the one expected for a standard accretion disk, fixing the parameter p to 0.75. This setting is inadequate, as it produces a best-fit model that clearly underestimates the source emission at both ends of the data energy range (see also the average spectrum residuals in Fig. 3, panel c). These systematics persisted when we released the temperature for each single spectrum.
Instead, we obtained a good fit without significant trends in the residuals (and χ2/ d.o.f. = 1452.3/1483) when we left both p and the temperatures as free fit parameters, with common values for all the datasets. The best-fit parameters for this fit are Tin = 1.48 ± 0.08 keV, p = 0.60 ± 0.02, and NHi = 0.031 ± 0.015 (here and in the following the uncertainties reported for each spectral parameter are at a 90% confidence level). We also verified that letting the model parameters vary independently for each data set does not improve the fit significantly, with paramenter values consistent within their errors among the single spectra. The observed (i.e., not corrected for absorption) fluxes resulting for each spectrum from this best -fit model (evaluated using the cflux convolution model in xspec) are reported in Table 1 and plotted in Fig. 2 (black circles). The source has an average 0.3−10 keV absorbed flux of (1.57 ± 0.02) × 10-11 erg cm-2 s-1 and variations of ≲15% around this value. The average luminosity, assuming isotropic emission at the distance of 817 Mpc (Freedman et al. 2001), is ~1.3 × 1039 erg s-1.
As the source does not show significant spectral variation throughout our monitoring, we used the average spectrum obtained from the entire dataset to refine the spectral analysis. Table 2 reports the best-fit spectral parameters obtained for the average spectrum using the diskpbb model. For completeness, we also report the fit results and residuals obtained with a simple power-law model and with a standard accretion disk model (p = 0.75): both fits are statistically inacceptable. In all models, an additional absorbing column was included to verify the presence of any intrinsic absorption. The absorbing column reported in the table is the best-fit value in excess of the Galactic line-of-sight value. Figure 3 shows the data with the best-fit model and the residuals relevant to the different models reported in Table 2. We also tested two two-component models, both used to describe a disk+corona geometry. In particular, we used a model composed of a power law plus a multicolor disk (diskbb) that resulted in a hot disk (the inner temperature is 1.15 keV) and a soft power law (with photon index 2.13), and a diskbbb+comptt model (with the temperature of the seed photons tied to the disk peak temperature), whose best-fit parameters suggest a cool disk (~0.50 keV) and a cool (with an electron temperature of ~1.1 keV) and optically thick (τ ~ 14) corona. Both models provided statistically acceptable fits for our data.
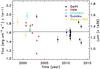 |
Fig. 2 Long-term light curve of M33 X-8. Each point corresponds to a single observation, and fluxes are not corrected for absorption. The luminosity on the right axis has been evaluated assuming a distance of 820 kpc. We have associated an arbitrary 5% statistical error to the BeppoSAX, Chandra, and Suzaku points. The horizontal line represents the Eddington luminosity for a 10 M⊙ black hole. |
Averaged spectrum of the 14 Swift/XRT observations: best-fit results.
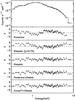 |
Fig. 3 Top panel: data and best-fit model (with model diskpbb) for the average M33 X-8 spectrum. Lower panels: residuals for the different spectral models reported in Table 2. |
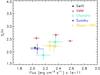 |
Fig. 4 Spectral colors evaluated as the ratio of the fluxes in the 0.3−3 keV (S) and 3−10 keV (H) bands. For the other datasets we used the best-fit models reported by Parmar et al. (2001) (Beppo-SAX), La Parola et al. (2003), Dubus et al. (2004) (Chandra), Middleton et al. (2011) (XMM-Newton), and Isobe et al. (2012) (Suzaku). The error on the ratio has been evaluated assuming the fractional error on each band to be equal to the fractional error on the total flux, when reported, or assuming an arbitrary error of 5% on the flux in each band when the error on the flux was lacking. All fluxes are corrected for absorption. |
Finally, we compared our spectral results with those derived in the past with other satellites. To this aim we report in Fig. 4 the spectral colors derived from the best-fit model for the data analyzed in this work and for all the datasets where enough spectral information is available in the literature. The plot shows that the spectral colors (evaluated as the ratio of the fluxes in the 0.3−3 keV and 3−10 keV bands) are mostly insensitive to the flux variations, showing that the spectral shape is not significantly variable within the current statistics used to constrain the spectrum.
4. Discussion
We investigated the spectral properties of the ultraluminous X-ray source M33 X-8, the closest persistent source of its class (820 Mpc), which is located in the vicinity of the nucleus of the nearby galaxy M33, through a Swift-XRT monitoring that consists of 15 observations that span six years.
M33 X-8 shows a weak flux variability over the entire XRT monitoring. Figure 2 shows the 0.3−10 keV 16-year long-term light curve of M33 X-8, also reporting the 0.3−10 keV flux (not corrected for absorption) observed in the past by SAX (Parmar et al. 2001), Chandra (La Parola et al. 2003; Dubus et al. 2004), XMM-Newton (Middleton et al. 2011), and Suzaku (Isobe et al. 2012). The flux variations observed with Swift are consistent with what was observed with the other satellites. The luminosity varies between 1.0 and 1.6 × 1039 erg s-1 and locates it at the low-luminosity end of the known ULX sample. Significant long-term flux variability is commonly observed in ULX, but the variability amplitude observed in M33 X-8 is lower than that observed in other persistent ULXs, which may reach a factor of ~5 in flux amplitude, as shown by Ho IX X-1, for instance, which shows wide flux variations like this on a monthly scale (La Parola et al. 2001; Vierdayanti et al. 2010). Several other examples can be found in the sample analyzed by Pintore et al. (2014), for example.
The energy spectrum obtained from the averaged Swift-XRT spectra shows an apparent curvature that makes it largely inconsistent with a simple power law. Instead, it can be well described by a thermal model: in particular, we obtained a very good description using either a disk model with a modified temperature profile (Watarai et al. 2000), or the two component models.
The simplest two component model (power law + disk) is a phenomenological model often used to describe the spectra of ULXs as an empirical description of a disk plus corona geometry. In the presence of a cool (kT ~ 0.1−0.4 keV) and luminous (L ~ 1039−1040 erg/s) disk, it allows inferring the presence of intermediate-mass black holes (e.g., Makishima et al. 2000). This is not the case for M33 X-8, where the disk component describes the high-energy part of the spectrum well and appears to be hot (kT ~ 1.15 keV), leaving a soft excess that is accounted for by the power law. The overall disk parameters are then inconsistent with a massive black hole, but instead are more typical of an ordinary stellar mass black hole: using the relationship between mass, temperature, and luminosity in a standard disk (see, e.g., Makishima et al. 2000), we derive a mass of ~10 M⊙ for a nonrotating black hole, consistent with the estimation obtained by data from other satellites (e.g., Foschini et al. 2006; Weng et al. 2009; Isobe et al. 2012). Sutton et al. (2013) developed a classification scheme based on a disk+power law fit, to be applied to ULX spectra, according to which the spectral state of an ULX source can be defined by the disk temperature, the power-law slope, and the ratio between the flux contribution of the two spectral components in the 0.3−1 keV band. Our result is consistent with that found by Sutton et al. (2013) using XMM-Newton data, and, according to their classification, it identifies M33 X-8 as a broadened disk source, or in other words, as a source whose spectrum is dominated by emission from a hot disk (see Table 2) and where the additional soft component may be the effect of an unrealistic description of the disk spectrum by the diskbb model. In fact, such hot-disk/soft power-law spectra are difficult to explain in the context of the analogy of ULXs with GBHs: the thermal state of GBHs is indeed characterized by a hot disk, but the presence of a soft power-law-like component in addition to the disk is unusual, and its physical interpretation is not simple: if this component is due to the presence of a Comptonized corona, we do not expect it to be dominant at energies lower than the temperature of the seed photons that come from the disk.
The same scenario of a Comptonized corona over an accretion disk can be modeled in a more physical way with a combination of a disk spectrum plus a Comptonized spectrum (diskbb + comptt in our modeling). Gladstone et al. (2009) derived a distinctive spectral sequence from the comparison of several sources, including M33 X-8, interpreting it with the progressive emergence of a (wind-driven) corona. A similar interpretation is given by Middleton et al. (2012) and Soria et al. (2015) for M31 ULX-1 and M83 ULX-1, respectively, showing how different spectral states correlate with the source luminosity. In this respect, our results suggest the presence of cool disk plus an optically thick corona. In general, this type of spectrum breaks the similarity between ULXs and Galactic black hole binaries, where a Comptonized corona over the disk is observed to be hotter (kT ≳ 50 keV) and thinner (τ ≲ 1) (e.g., Kubota & Done 2004). A noteworthy exception among GBHs is the microquasar GRS 1915+105, which was observed during its soft phase (which is associated to near-Eddington accretion) to show a low-temperature high-opacity Comptonized spectrum (Ueda et al. 2009). Recent simulations (Ohsuga et al. 2009) have shown that the strong radiation pressure that results from a high accretion rate may induce important outflows from the inner part of the disk, resulting in a low temperature, optically thick Comptonizing wind that blocks the view to the inner and hottest part of the disk. This becomes visible again as the radiation pressure decreases and the wind weakens, reducing its launching radius. The accretion flow in faint ULXs such as M33 X-8 may be different from the one described by these simulations, which assume higher accretion rates, but winds driven by radiation pressure may be at work in this case as well. This mechanism (described for example in Middleton et al. 2012 to explain the spectral behavior of an ULX in M31) also explains the deviation of the luminosity/temperature relation from the one expected form a standard disk (L ∝ T4) because higher luminosities correspond to the disk being truncated at larger radii by the radiation pressure of the wind.
The slim-disk hypothesis has previously been proposed as a physically consistent description of the spectrum from this source by Weng et al. (2009) on the basis of an observing campaign carried on with XMM-Newton and by Isobe et al. (2012) from the analysis of a Suzaku observation. Middleton et al. (2011) also suggested the emergence of a thick Comptonized corona over the disk as the flux increases: such a hard component is required to describe the data of their highest flux bin (F0.3−10> 1.9 × 10⁻¹¹ erg cm-2 s-1). With the present data, however, we are unable to verify this hypothesis because the source never reached such a high flux level during our monitoring.
If the slim-disk interpretation is correct, we find a value of the temperature gradient p of 0.60 ± 0.02, which is inconsistent with the standard disk value of 0.75, thus implying that the disk is in an advective regime, with a super-critical accretion rate: according to Watarai et al. (2000), the observed luminosity and temperature are consistent with a mass accretion rate of a factor of 10 higher than the critical rate for a mass of ~10 M⊙.
See http://www.swift.ac.uk/analysis/xrt/pileup.php for a complete description of this procedure.
Acknowledgments
This work has been supported by ASI grant I/011/07/0.
References
- Abramowicz, M. A., Czerny, B., Lasota, J. P., & Szuszkiewicz, E. 1988, ApJ, 332, 646 [NASA ADS] [CrossRef] [Google Scholar]
- Anders, E., & Grevesse, N. 1989, Geochim. Cosmochim. Acta, 53, 197 [Google Scholar]
- Bachetti, M., Rana, V., Walton, D. J., et al. 2013, ApJ, 778, 163 [NASA ADS] [CrossRef] [Google Scholar]
- Bachetti, M., Harrison, F. A., Walton, D. J., et al. 2014, Nature, 514, 202 [NASA ADS] [CrossRef] [Google Scholar]
- Begelman, M. C., King, A. R., & Pringle, J. E. 2006, MNRAS, 370, 399 [NASA ADS] [CrossRef] [Google Scholar]
- Burrows, D. N., Hill, J. E., Nousek, J. A., et al. 2004, Proc. SPIE, 5165, 201 [NASA ADS] [CrossRef] [Google Scholar]
- Colbert, E. J. M., & Mushotzky, R. F. 1999, ApJ, 519, 89 [NASA ADS] [CrossRef] [Google Scholar]
- Dubus, G., Charles, P. A., Long, K. S., & Hakala, P. J. 1997, ApJ, 490, L47 [NASA ADS] [CrossRef] [Google Scholar]
- Dubus, G., Charles, P. A., & Long, K. S. 2004, A&A, 425, 95 [NASA ADS] [CrossRef] [EDP Sciences] [Google Scholar]
- Ebisawa, K., Życki, P., Kubota, A., Mizuno, T., & Watarai, K.-Y. 2003, ApJ, 597, 780 [NASA ADS] [CrossRef] [Google Scholar]
- Fabbiano, G. 1989, ARA&A, 27, 87 [NASA ADS] [CrossRef] [Google Scholar]
- Feng, H., & Kaaret, P. 2010, ApJ, 712, L169 [NASA ADS] [CrossRef] [Google Scholar]
- Feng, H., & Soria, R. 2011, New A Rev., 55, 166 [NASA ADS] [CrossRef] [Google Scholar]
- Foschini, L., Ebisawa, K., Kawaguchi, T., et al. 2006, Adv. Space Res., 38, 1378 [NASA ADS] [CrossRef] [Google Scholar]
- Freedman, W. L., Madore, B. F., Gibson, B. K., et al. 2001, ApJ, 553, 47 [NASA ADS] [CrossRef] [Google Scholar]
- Fryer, C. L., Woosley, S. E., & Heger, A. 2001, ApJ, 550, 372 [NASA ADS] [CrossRef] [Google Scholar]
- Gebhardt, K., Lauer, T. R., Kormendy, J., et al. 2001, AJ, 122, 2469 [NASA ADS] [CrossRef] [Google Scholar]
- Gehrels, N., Chincarini, G., Giommi, P., et al. 2004, ApJ, 611, 1005 [NASA ADS] [CrossRef] [Google Scholar]
- Gladstone, J. C., Roberts, T. P., & Done, C. 2009, MNRAS, 397, 1836 [NASA ADS] [CrossRef] [Google Scholar]
- Grisé, F., Kaaret, P., Feng, H., Kajava, J. J. E., & Farrell, S. A. 2010, ApJ, 724, L148 [NASA ADS] [CrossRef] [Google Scholar]
- Hill, J. E., Burrows, D. N., Nousek, J. A., et al. 2004, Proc. SPIE, 5165, 217 [NASA ADS] [CrossRef] [Google Scholar]
- Isobe, N., Kubota, A., Sato, H., & Mizuno, T. 2012, PASJ, 64, 119 [NASA ADS] [Google Scholar]
- Kalberla, P. M. W., Burton, W. B., Hartmann, D., et al. 2005, A&A, 440, 775 [NASA ADS] [CrossRef] [EDP Sciences] [Google Scholar]
- King, A. R. 2009, MNRAS, 393, L41 [NASA ADS] [Google Scholar]
- King, A. R., & Dehnen, W. 2005, MNRAS, 357, 275 [NASA ADS] [CrossRef] [Google Scholar]
- King, A. R., Davies, M. B., Ward, M. J., Fabbiano, G., & Elvis, M. 2001, ApJ, 552, L109 [NASA ADS] [CrossRef] [Google Scholar]
- Kong, A. K. H., Yang, Y. J., Yen, T.-C., Feng, H., & Kaaret, P. 2010, ApJ, 722, 1816 [NASA ADS] [CrossRef] [Google Scholar]
- Kubota, A., & Done, C. 2004, MNRAS, 353, 980 [NASA ADS] [CrossRef] [Google Scholar]
- La Parola, V., Peres, G., Fabbiano, G., Kim, D. W., & Bocchino, F. 2001, ApJ, 556, 47 [NASA ADS] [CrossRef] [Google Scholar]
- La Parola, V., Damiani, F., Fabbiano, G., & Peres, G. 2004, ApJ, 583, 758 [Google Scholar]
- Long, K. S., Dodorico, S., Charles, P. A., & Dopita, M. A. 1981, ApJ, 246, L61 [NASA ADS] [CrossRef] [Google Scholar]
- Madau, P., & Rees, M. J. 2001, ApJ, 551, L27 [NASA ADS] [CrossRef] [Google Scholar]
- Makishima, K., Kubota, A., Mizuno, T., et al. 2000, ApJ, 535, 632 [NASA ADS] [CrossRef] [Google Scholar]
- Middleton, M. J., Sutton, A. D., & Roberts, T. P. 2011, MNRAS, 417, 464 [NASA ADS] [CrossRef] [Google Scholar]
- Middleton, M. J., Sutton, A. D., Roberts, T. P., Jackson, F. E., & Done, C. 2012, MNRAS, 420, 2969 [NASA ADS] [CrossRef] [Google Scholar]
- Middleton, M. J., Heil, L., Pintore, F., Walton, D. J., & Roberts, T. P. 2015, MNRAS, 447, 3243 [NASA ADS] [CrossRef] [Google Scholar]
- Miller, M. C., & Hamilton, D. P. 2002, MNRAS, 330, 232 [NASA ADS] [CrossRef] [MathSciNet] [Google Scholar]
- Moretti, A., Campana, S., Mineo, T., et al. 2005, Proc. SPIE, 5898, 360 [Google Scholar]
- Ohsuga, K., Mineshige, S., Mori, M., & Kato, Y. 2009, PASJ, 61, L7 [NASA ADS] [Google Scholar]
- Parmar, A. N., Sidoli, L., Oosterbroek, T., et al. 2001, A&A, 368, 420 [NASA ADS] [CrossRef] [EDP Sciences] [Google Scholar]
- Pintore, F., Zampieri, L., Wolter, A., & Belloni, T. 2014, MNRAS, 439, 3461 [NASA ADS] [CrossRef] [Google Scholar]
- Poutanen, J., Lipunova, G., Fabrika, S., Butkevich, A. G., & Abolmasov, P. 2007, MNRAS, 377, 1187 [NASA ADS] [CrossRef] [Google Scholar]
- Shakura, N. I., & Sunyaev, R. A. 1973, A&A, 24, 337 [NASA ADS] [Google Scholar]
- Soria, R. 2011, Astron. Nachr., 332, 330 [NASA ADS] [CrossRef] [Google Scholar]
- Soria, R., Kuntz, K. D., Long, K. S., et al. 2015, ApJ, 799, 140 [NASA ADS] [CrossRef] [Google Scholar]
- Stobbart, A.-M., Roberts, T. P., & Warwick, R. S. 2006, MNRAS, 370, 25 [NASA ADS] [CrossRef] [Google Scholar]
- Sutton, A. D., Roberts, T. P., Walton, D. J., Gladstone, J. C., & Scott, A. E. 2012, MNRAS, 423, 1154 [NASA ADS] [CrossRef] [Google Scholar]
- Sutton, A. D., Roberts, T. P., & Middleton, M. J. 2013, MNRAS, 435, 1758 [NASA ADS] [CrossRef] [Google Scholar]
- Swartz, D. A., Soria, R., Tennant, A. F., & Yukita, M. 2011, ApJ, 741, 49 [NASA ADS] [CrossRef] [Google Scholar]
- Trinchieri, G., Fabbiano, G., & Peres, G. 1988, ApJ, 325, 531 [NASA ADS] [CrossRef] [Google Scholar]
- Vierdayanti, K., Done, C., Roberts, T. P., & Mineshige, S. 2010, MNRAS, 403, 1206 [NASA ADS] [CrossRef] [Google Scholar]
- Ueda, Y., Yamaoka, K., & Remillard, R. 2009, ApJ, 695, 888 [NASA ADS] [CrossRef] [Google Scholar]
- Walton, D. J., Harrison, F. A., Grefenstette, B. W., et al. 2014, ApJ, 793, 21 [NASA ADS] [CrossRef] [Google Scholar]
- Watarai, K.-Y., Fukue, J., & Takeuchi, M., Mineshige, S. 2000, PASJ, 52, 133 [NASA ADS] [CrossRef] [Google Scholar]
- Weng, S.-S., Wang, J.-X., Gu, W.-M., & Lu, J.-F. 2009, PASJ, 61, 1287 [NASA ADS] [Google Scholar]
- Winter, L. M., Mushotzky, R. F., & Reynolds, C. S. 2006, ApJ, 649, 730 [NASA ADS] [CrossRef] [Google Scholar]
All Tables
All Figures
|
Fig. 1 X-ray image of M33 obtained by cumulating all the Swift-XRT observations, with the optical contour levels superimposed, showing the position of M33 X-8 coincident with the optical center of the galaxy. Contour levels are derived from the DSS image3 and have a linear spacing in intensity with a constant ratio of 0.13 beetween consecutive levels and the faintest level corresponding to 10% of the maximum intensity in the image. |
| In the text | |
|
Fig. 2 Long-term light curve of M33 X-8. Each point corresponds to a single observation, and fluxes are not corrected for absorption. The luminosity on the right axis has been evaluated assuming a distance of 820 kpc. We have associated an arbitrary 5% statistical error to the BeppoSAX, Chandra, and Suzaku points. The horizontal line represents the Eddington luminosity for a 10 M⊙ black hole. |
| In the text | |
|
Fig. 3 Top panel: data and best-fit model (with model diskpbb) for the average M33 X-8 spectrum. Lower panels: residuals for the different spectral models reported in Table 2. |
| In the text | |
|
Fig. 4 Spectral colors evaluated as the ratio of the fluxes in the 0.3−3 keV (S) and 3−10 keV (H) bands. For the other datasets we used the best-fit models reported by Parmar et al. (2001) (Beppo-SAX), La Parola et al. (2003), Dubus et al. (2004) (Chandra), Middleton et al. (2011) (XMM-Newton), and Isobe et al. (2012) (Suzaku). The error on the ratio has been evaluated assuming the fractional error on each band to be equal to the fractional error on the total flux, when reported, or assuming an arbitrary error of 5% on the flux in each band when the error on the flux was lacking. All fluxes are corrected for absorption. |
| In the text | |
Current usage metrics show cumulative count of Article Views (full-text article views including HTML views, PDF and ePub downloads, according to the available data) and Abstracts Views on Vision4Press platform.
Data correspond to usage on the plateform after 2015. The current usage metrics is available 48-96 hours after online publication and is updated daily on week days.
Initial download of the metrics may take a while.