Fig. 8
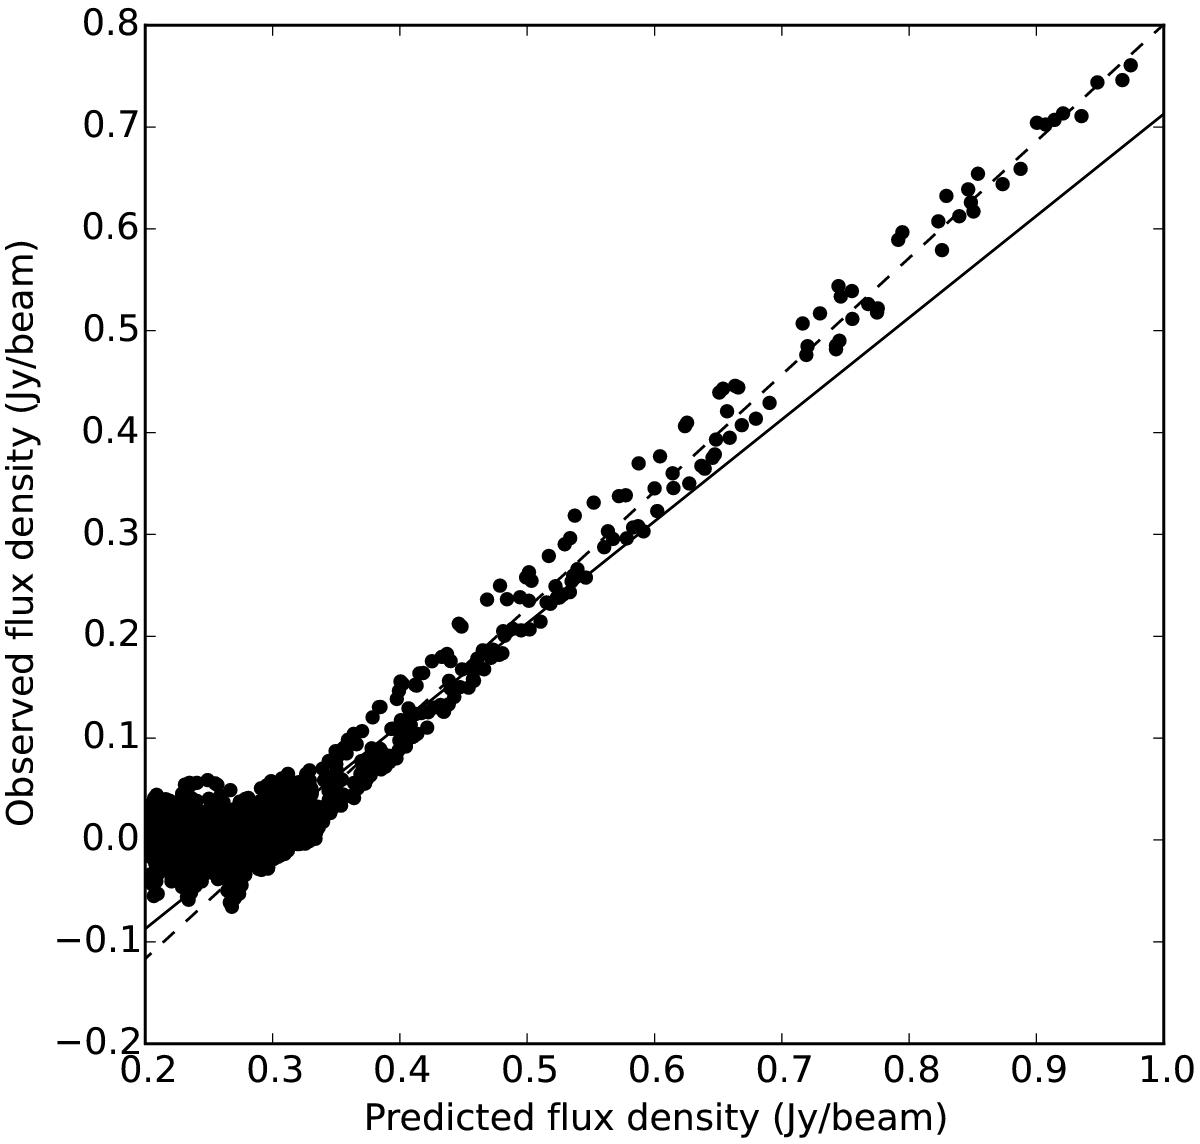
Comparison of the observed submillimeter flux density from Laboca and the predicted flux density based on the Herschel/Planck model. The dashed line shows a linear fit of all points with a predicted flux density of >0.4 Jy/beam. For comparison, the continuous line indicates the reference slope of 1 (arbitrarily set to intersect with the fit at its starting point of x = 0.4 Jy/beam) which would correspond to β = βPlanck. The difference in slope corresponds to a difference of Δβ = 0.15 (see text).
Current usage metrics show cumulative count of Article Views (full-text article views including HTML views, PDF and ePub downloads, according to the available data) and Abstracts Views on Vision4Press platform.
Data correspond to usage on the plateform after 2015. The current usage metrics is available 48-96 hours after online publication and is updated daily on week days.
Initial download of the metrics may take a while.