Free Access
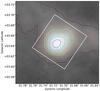
Fig. 2
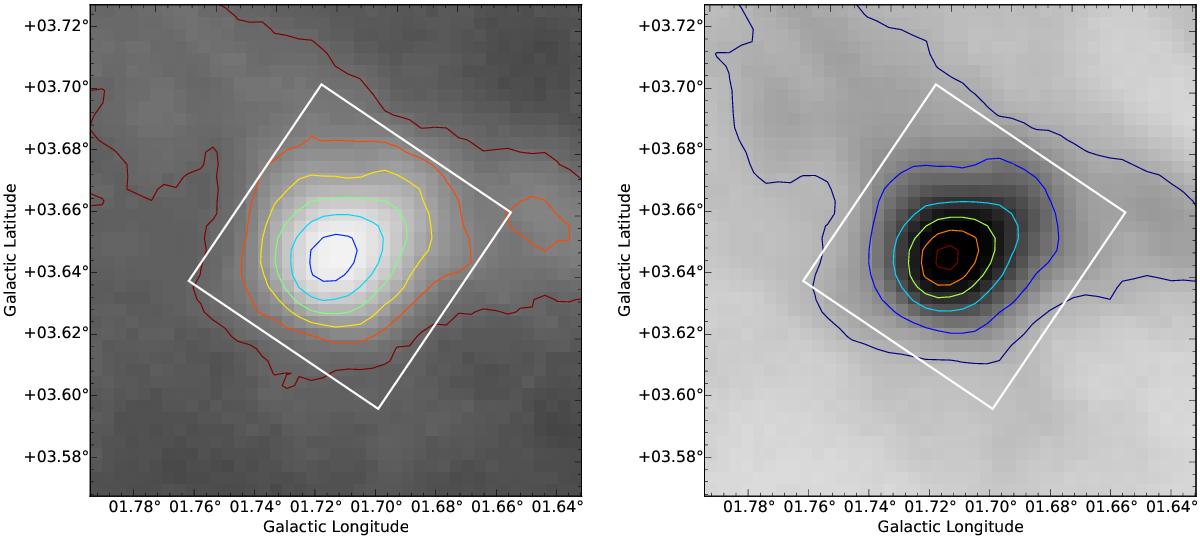
Left: effective dust temperature map of FeSt 1-457, 36′′FWHM, with contours indicating temperatures of 20 K down to 14 K in steps of 1 K. Right: corresponding optical depth map, with contours indicating levels of 2, 3, 5, 7, 9, and 11 × 10-4. In both panels, the white box indicates the field of view of Fig. 1.
This figure is made of several images, please see below:
Current usage metrics show cumulative count of Article Views (full-text article views including HTML views, PDF and ePub downloads, according to the available data) and Abstracts Views on Vision4Press platform.
Data correspond to usage on the plateform after 2015. The current usage metrics is available 48-96 hours after online publication and is updated daily on week days.
Initial download of the metrics may take a while.