Free Access
Fig. 9
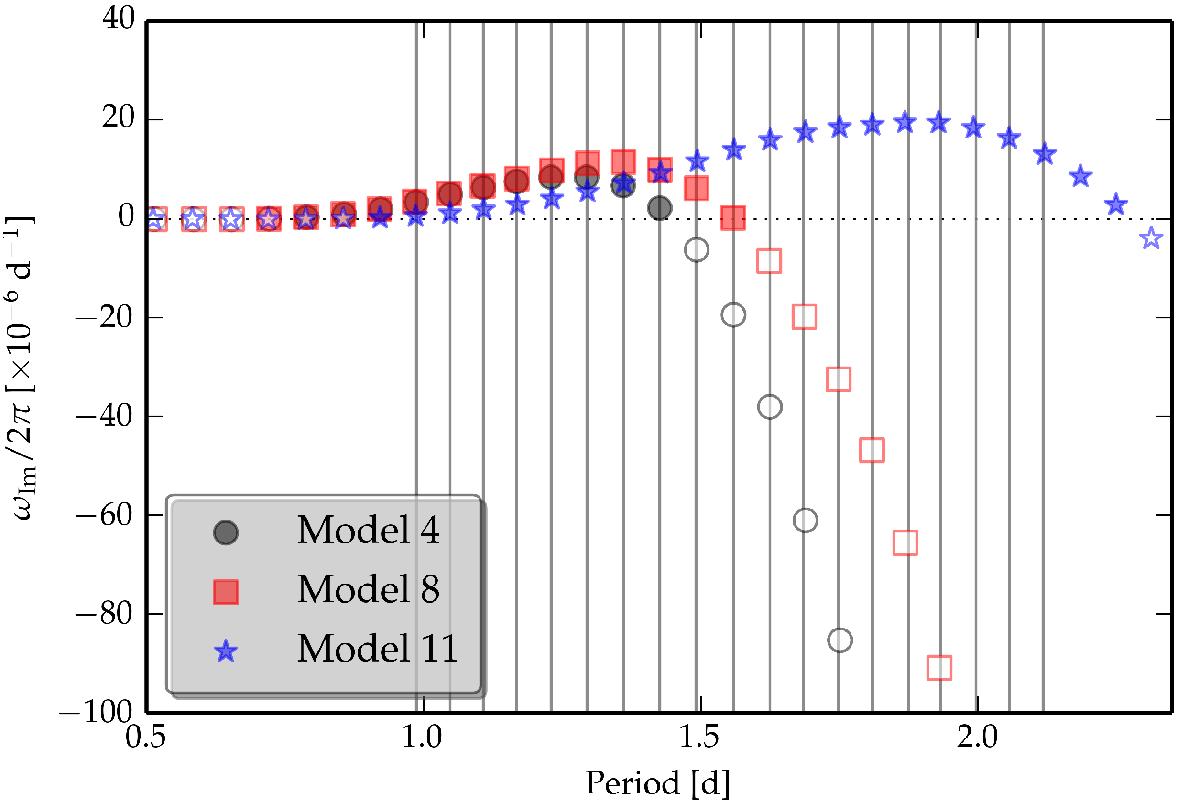
Non-adiabatic instability study of Model 4 (black circles), Model 8 (red squares), and Model 11 (blue stars) from Table 3. The imaginary part of the eigenfrequency ωIm is plotted against the mode period (vertical lines). Filled (empty) symbols designate excited (damped) modes.
Current usage metrics show cumulative count of Article Views (full-text article views including HTML views, PDF and ePub downloads, according to the available data) and Abstracts Views on Vision4Press platform.
Data correspond to usage on the plateform after 2015. The current usage metrics is available 48-96 hours after online publication and is updated daily on week days.
Initial download of the metrics may take a while.