Fig. 4
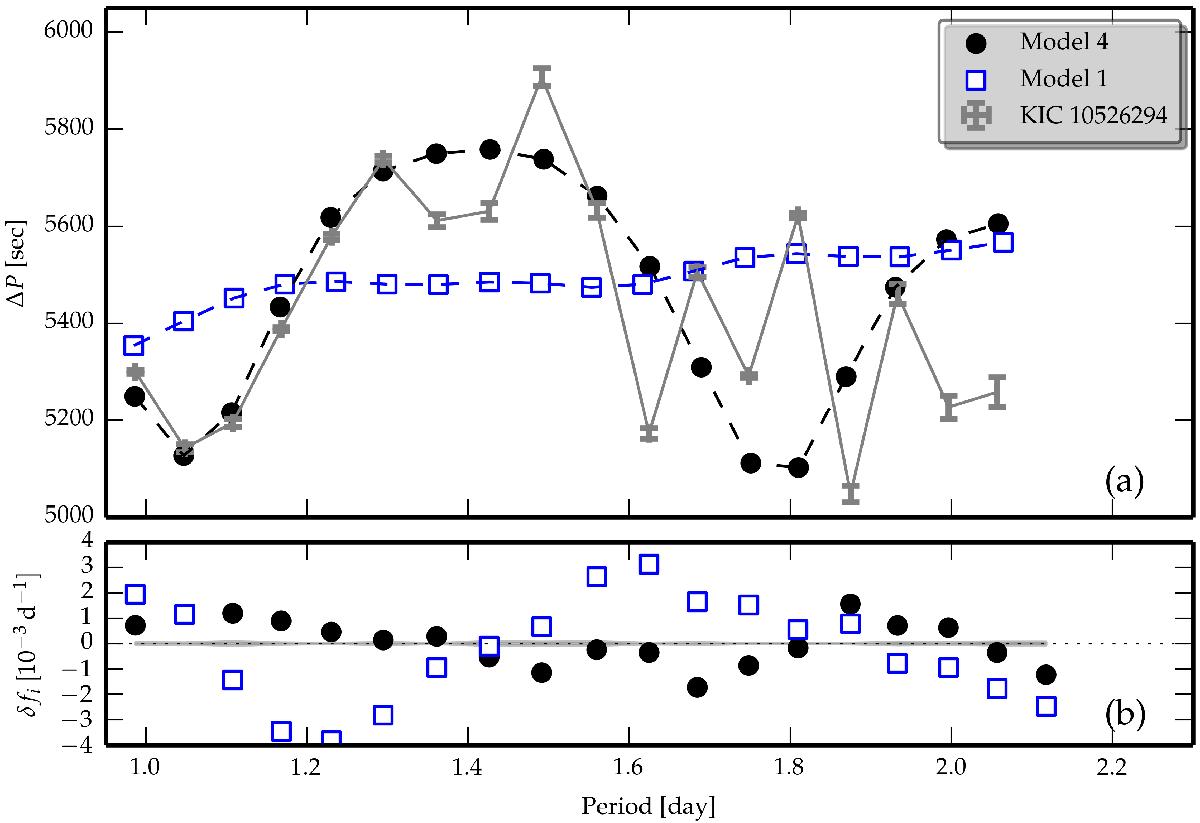
a) Period and period spacings for Model 4 (filled circles) and Model 1 (empty squares) from Table 3. The observed pattern is shown in grey. b) The frequency difference between model frequencies and those detected in the observations δfi from Eq. (6). Compared to Fig. 1b, the ordinate is enlarged 40 times; the grey band around zero is the 1σ frequency uncertainty range σi. A similar plot for Model 4, Model 8, and Model 11 is shown in Figs. A.1 and A.2 in the Appendix.
Current usage metrics show cumulative count of Article Views (full-text article views including HTML views, PDF and ePub downloads, according to the available data) and Abstracts Views on Vision4Press platform.
Data correspond to usage on the plateform after 2015. The current usage metrics is available 48-96 hours after online publication and is updated daily on week days.
Initial download of the metrics may take a while.