Free Access
Fig. 3
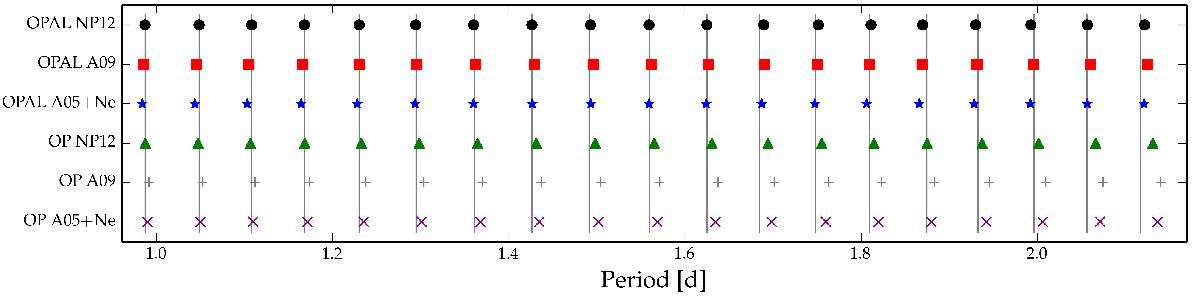
Comparison between observed periods (vertical lines) and those of six models with different mixtures and opacity tables. All parameters of the models are identical, except their mixture and opacities. The widths of the vertical lines are larger than the measured pulsation period uncertainties.
Current usage metrics show cumulative count of Article Views (full-text article views including HTML views, PDF and ePub downloads, according to the available data) and Abstracts Views on Vision4Press platform.
Data correspond to usage on the plateform after 2015. The current usage metrics is available 48-96 hours after online publication and is updated daily on week days.
Initial download of the metrics may take a while.