Fig. 9
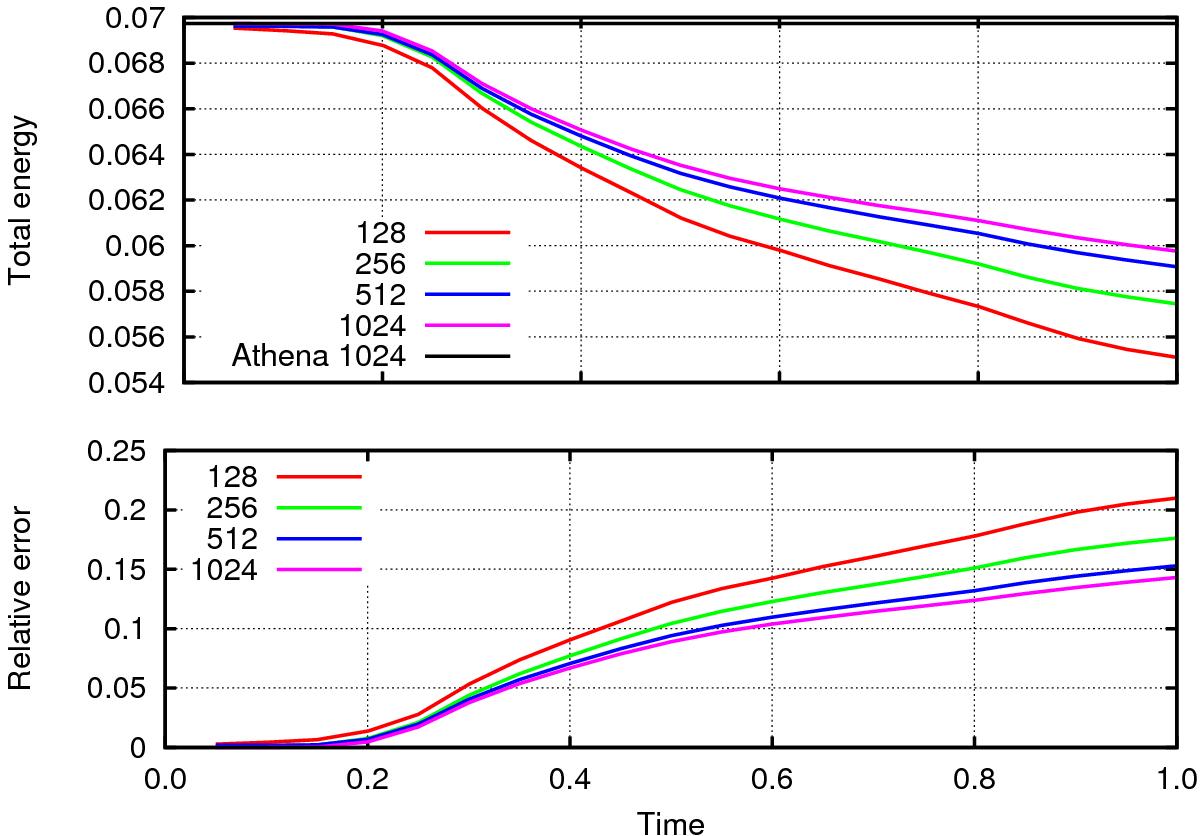
Time evolution of the simulated total energy (upper panel) and its relative deviation from its conserved value (lower panel) as obtained by the 2D Orszag-Tang test using GOEMHD3 in dependence on the mesh resolution of 1282 (red), 2562 (green), 5122 (blue), and 10242 (magenta) grid points. The black line overlaid in the upper panel corresponds to the volume energy density of 0.0697 rescaled from the surface density that was obtained by the ATHENA code run for 10242 grid points.
Current usage metrics show cumulative count of Article Views (full-text article views including HTML views, PDF and ePub downloads, according to the available data) and Abstracts Views on Vision4Press platform.
Data correspond to usage on the plateform after 2015. The current usage metrics is available 48-96 hours after online publication and is updated daily on week days.
Initial download of the metrics may take a while.