Fig. 2
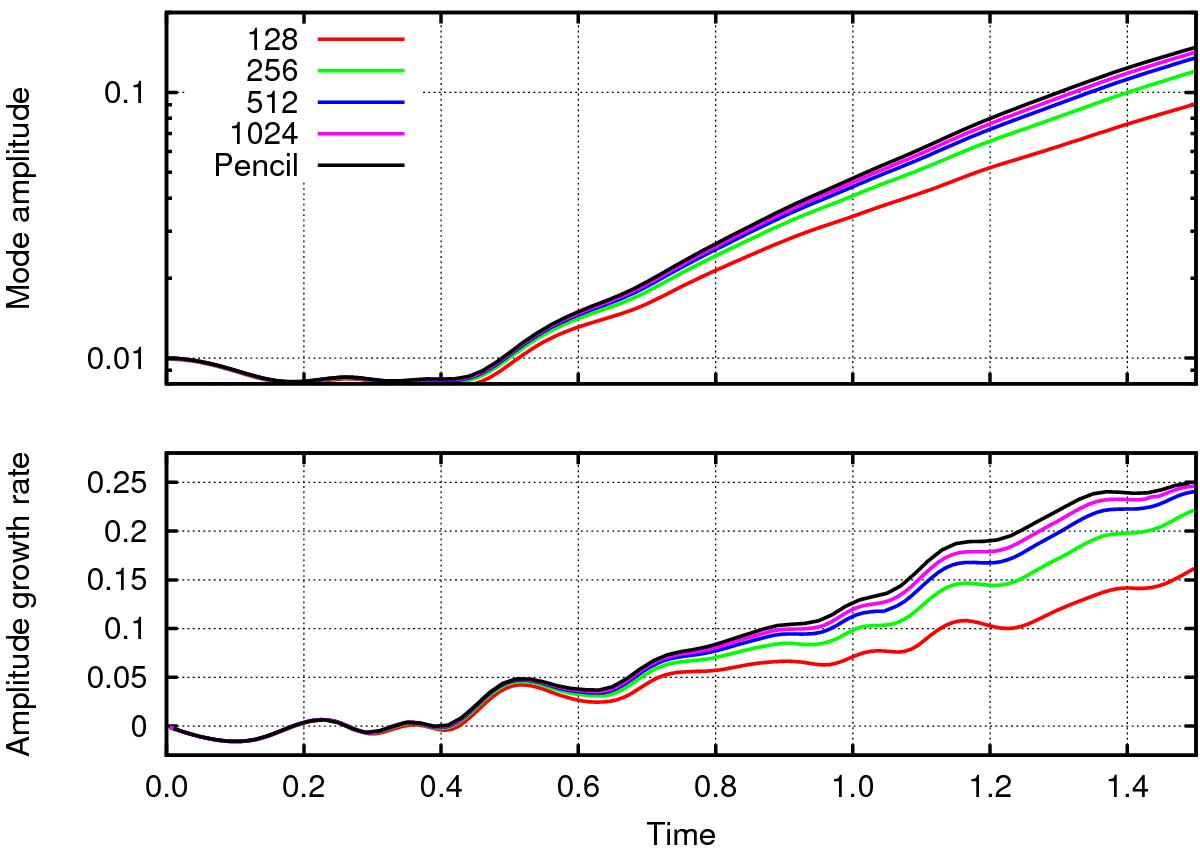
Time evolution of the y-velocity mode amplitude Ay (top panel) and of its growth rate Ȧy (bottom panel) in the course of the Kelvin-Helmholtz test. The results obtained by GOEMHD3 for different spatial resolutions are color-coded according to the legend. The black line corresponds to the result obtained by a PENCIL code run using a grid resolution of 40962 (McNally et al. 2012).
Current usage metrics show cumulative count of Article Views (full-text article views including HTML views, PDF and ePub downloads, according to the available data) and Abstracts Views on Vision4Press platform.
Data correspond to usage on the plateform after 2015. The current usage metrics is available 48-96 hours after online publication and is updated daily on week days.
Initial download of the metrics may take a while.