Fig. 19
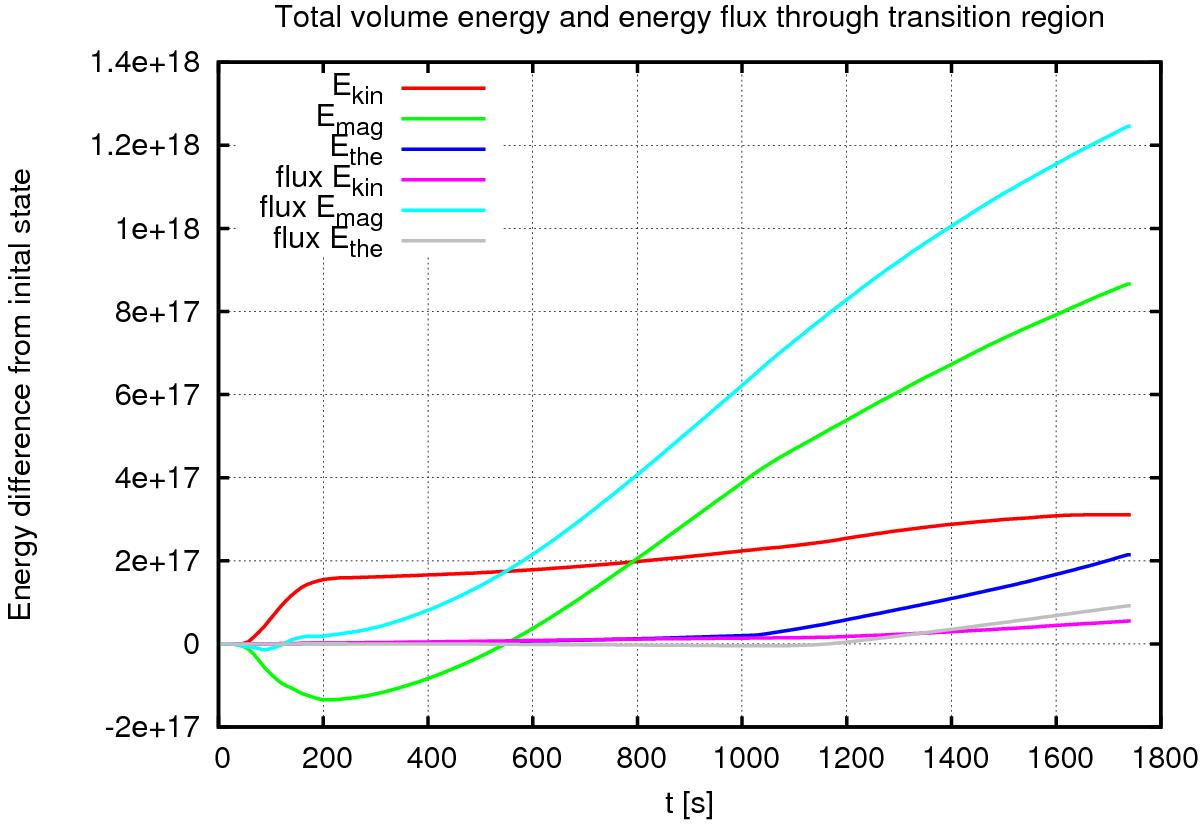
Scaling test simulating the solar corona above AR 1429. We show the temporal evolution of thermal, kinetic, and magnetic energies within corona above the transition region. The energy fluxes of the thermal, kinetic, and magnetic energies from the chromosphere are denoted by flux. For the meaning of the different lines see the line form legend. After t ~ 16 min the background resistivity is enhanced, causing Joule heating.
Current usage metrics show cumulative count of Article Views (full-text article views including HTML views, PDF and ePub downloads, according to the available data) and Abstracts Views on Vision4Press platform.
Data correspond to usage on the plateform after 2015. The current usage metrics is available 48-96 hours after online publication and is updated daily on week days.
Initial download of the metrics may take a while.