Fig. 13
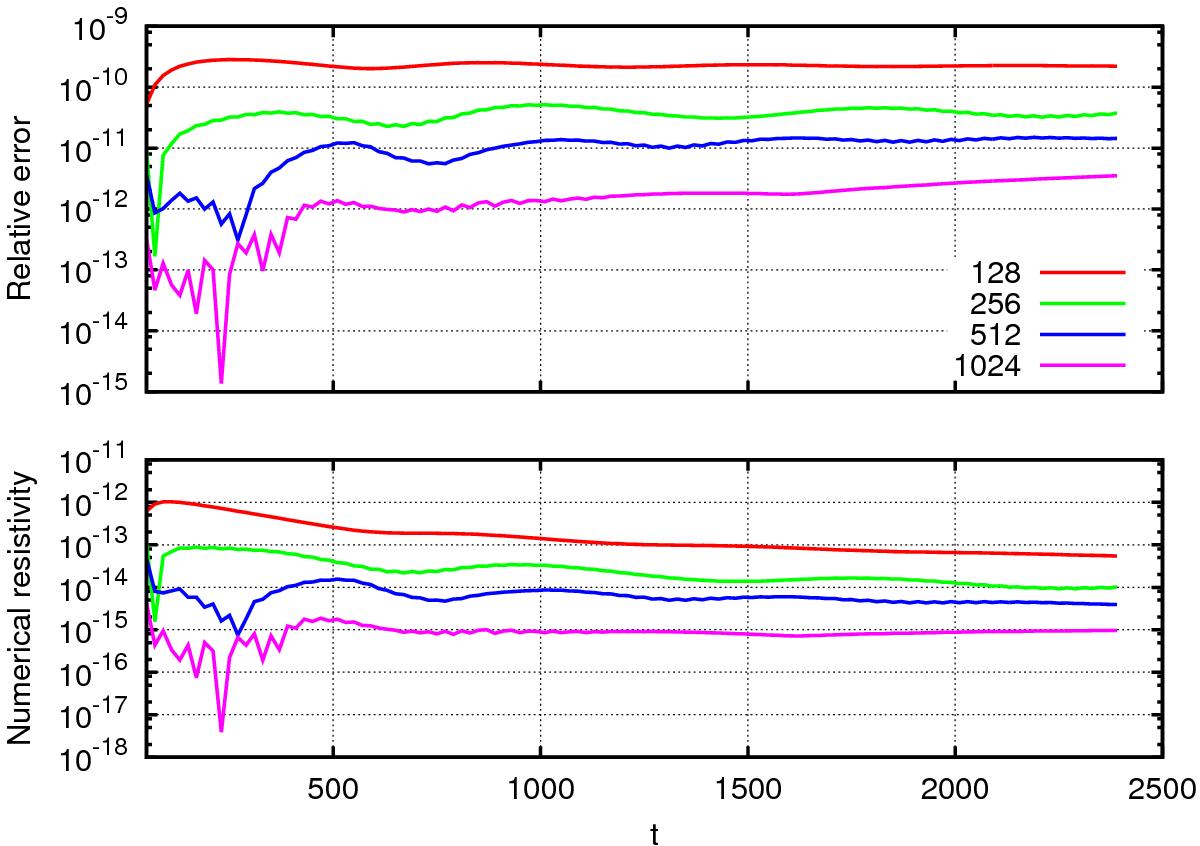
Time evolution of the relative deviation | ΔBz/ tanh(ym) | of the magnetic field from the analytical prediction (top) and derived effective numerical resistivity ηn (bottom) at position (ym,zm) = (−0.5493,0) for the simulation of a Harris-like current sheet. Results for different spatial resolutions (number of grid points in y direction) are color-coded according to the legend. The high-frequency oscillations are caused by the mesh drift instability of the staggered leap-frog scheme, which is not explicitly damped in this simulation setup (cf. Sect. 2.2).
Current usage metrics show cumulative count of Article Views (full-text article views including HTML views, PDF and ePub downloads, according to the available data) and Abstracts Views on Vision4Press platform.
Data correspond to usage on the plateform after 2015. The current usage metrics is available 48-96 hours after online publication and is updated daily on week days.
Initial download of the metrics may take a while.