Fig. 12
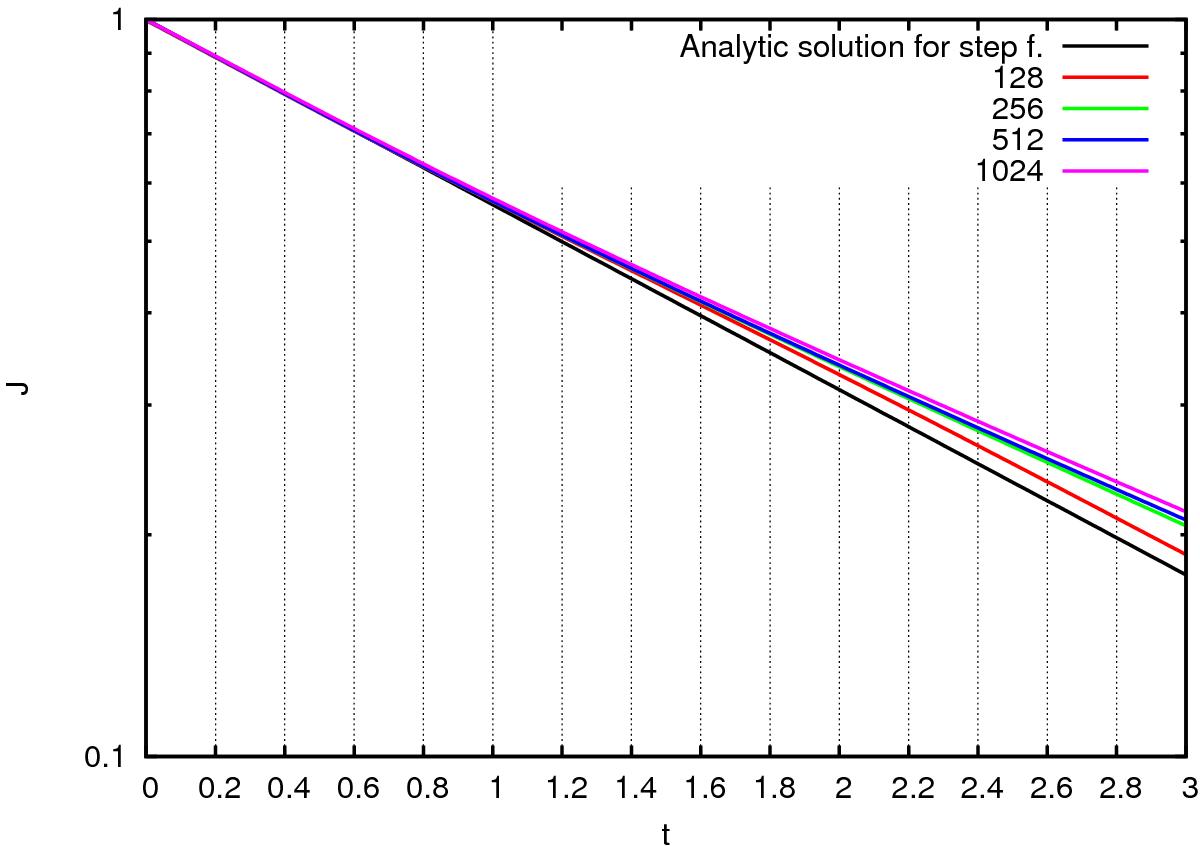
GOEMHD3 simulation of the time evolution of the current density jx at the center of a current cylinder assuming a smooth change of the resistivity. Colored lines correspond to different mesh resolutions employed for the simulations. Note that, since no analytical solution exists for this problem, the solid black line still corresponds to the analytic solution for a step-funtion-like change of the resistivity as given by Eq. (23) – as in Fig. 10.
Current usage metrics show cumulative count of Article Views (full-text article views including HTML views, PDF and ePub downloads, according to the available data) and Abstracts Views on Vision4Press platform.
Data correspond to usage on the plateform after 2015. The current usage metrics is available 48-96 hours after online publication and is updated daily on week days.
Initial download of the metrics may take a while.