Fig. 5
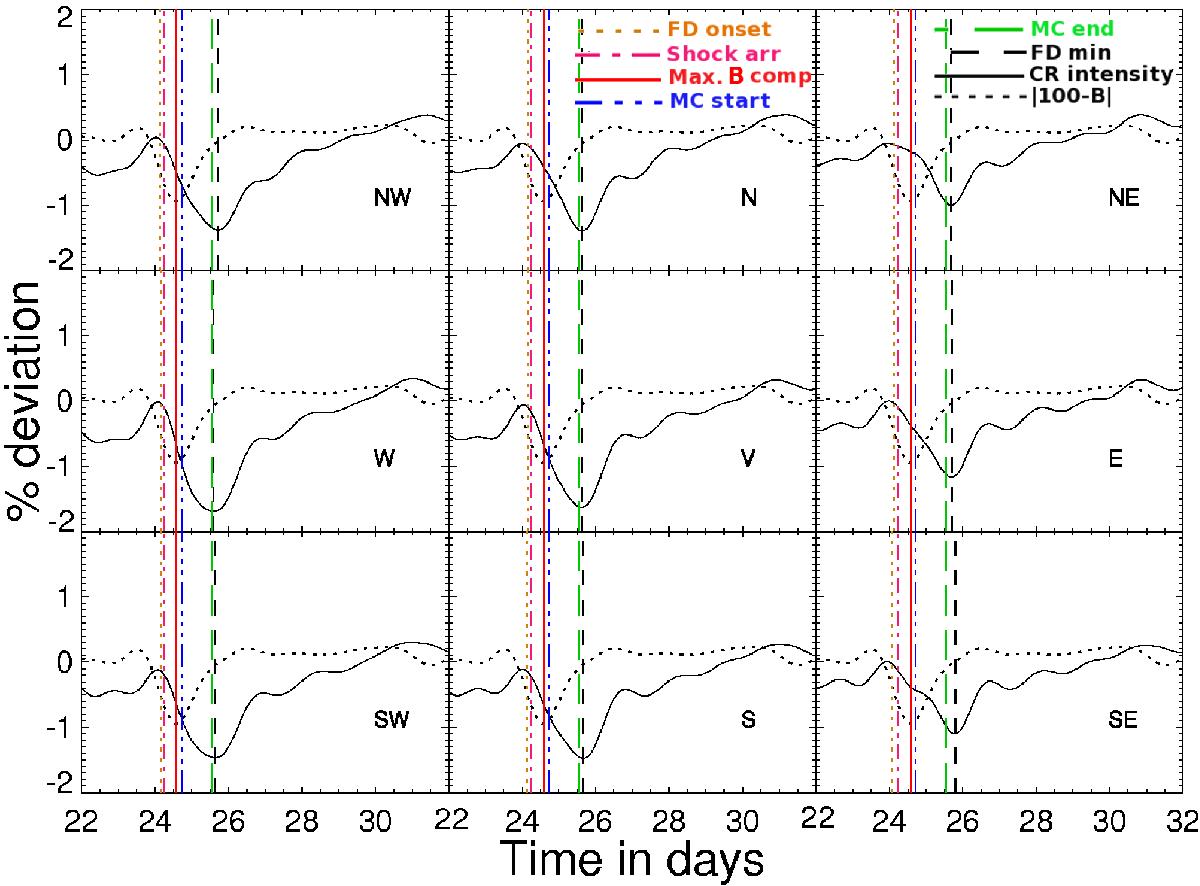
FD event on 24 November 2001. The black solid line denotes percentage deviation of the cosmic ray intensity, black dotted line percentage deviation of total magnetic field | 100−B | as explained in Sect. 2 which is scaled down to fit the frame. The vertical brown-dotted, magenta-dash-dotted, blue-dash-dot-dotted, green-long-dashed, and black-dashed lines denote the timings corresponding to the FD onset, shock arrival, magnetic cloud start, magnetic cloud end, and FD minimum, respectively. The solid red vertical line corresponds to the maximum of the magnetic field compression.
Current usage metrics show cumulative count of Article Views (full-text article views including HTML views, PDF and ePub downloads, according to the available data) and Abstracts Views on Vision4Press platform.
Data correspond to usage on the plateform after 2015. The current usage metrics is available 48-96 hours after online publication and is updated daily on week days.
Initial download of the metrics may take a while.