Fig. 30
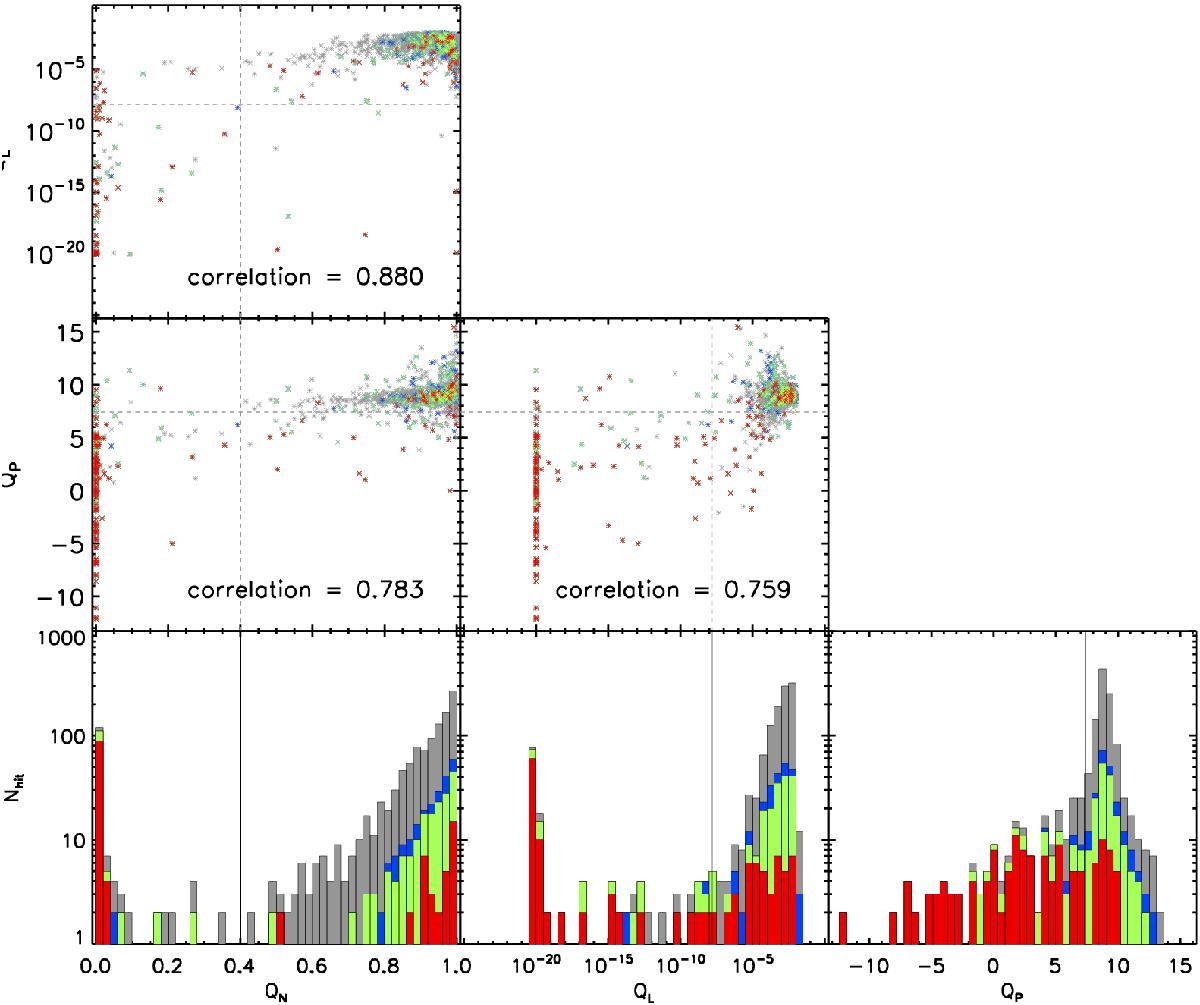
Piled-up distribution of the quality factors QN, QL, and QP for the PSZ1 sources (grey: confirmed clusters, blue: class1, green: class 2, red: class 3). The vertical solid line represents the cut separating the population of high- and low-quality detections. The 2D scatter plots show the cuts for the pair of quality factors under consideration. The vertical solid lines show the threshold QN = 0.4, QL = 1.5 × 10⁻⁸, and QP = 7.4.
Current usage metrics show cumulative count of Article Views (full-text article views including HTML views, PDF and ePub downloads, according to the available data) and Abstracts Views on Vision4Press platform.
Data correspond to usage on the plateform after 2015. The current usage metrics is available 48-96 hours after online publication and is updated daily on week days.
Initial download of the metrics may take a while.