Free Access
Fig. 26
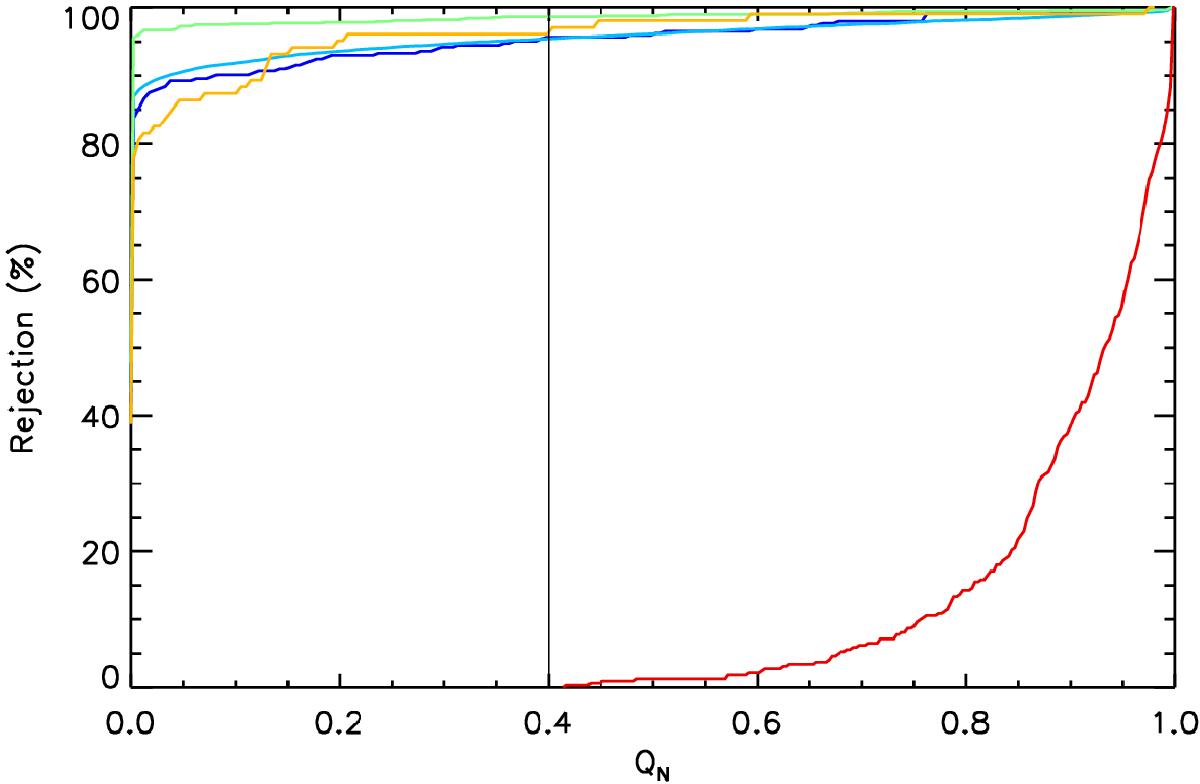
For the PSZ1 checking-set sample: fraction of rejected sources as a function of the quality factor QN cut. In red and orange are the true clusters and false detections, respectively. We also display in blue, cyan, and green the radio, IR, and cold Galactic sources. The vertical solid line shows the threshold QN = 0.4.
Current usage metrics show cumulative count of Article Views (full-text article views including HTML views, PDF and ePub downloads, according to the available data) and Abstracts Views on Vision4Press platform.
Data correspond to usage on the plateform after 2015. The current usage metrics is available 48-96 hours after online publication and is updated daily on week days.
Initial download of the metrics may take a while.