Free Access
Fig. 24
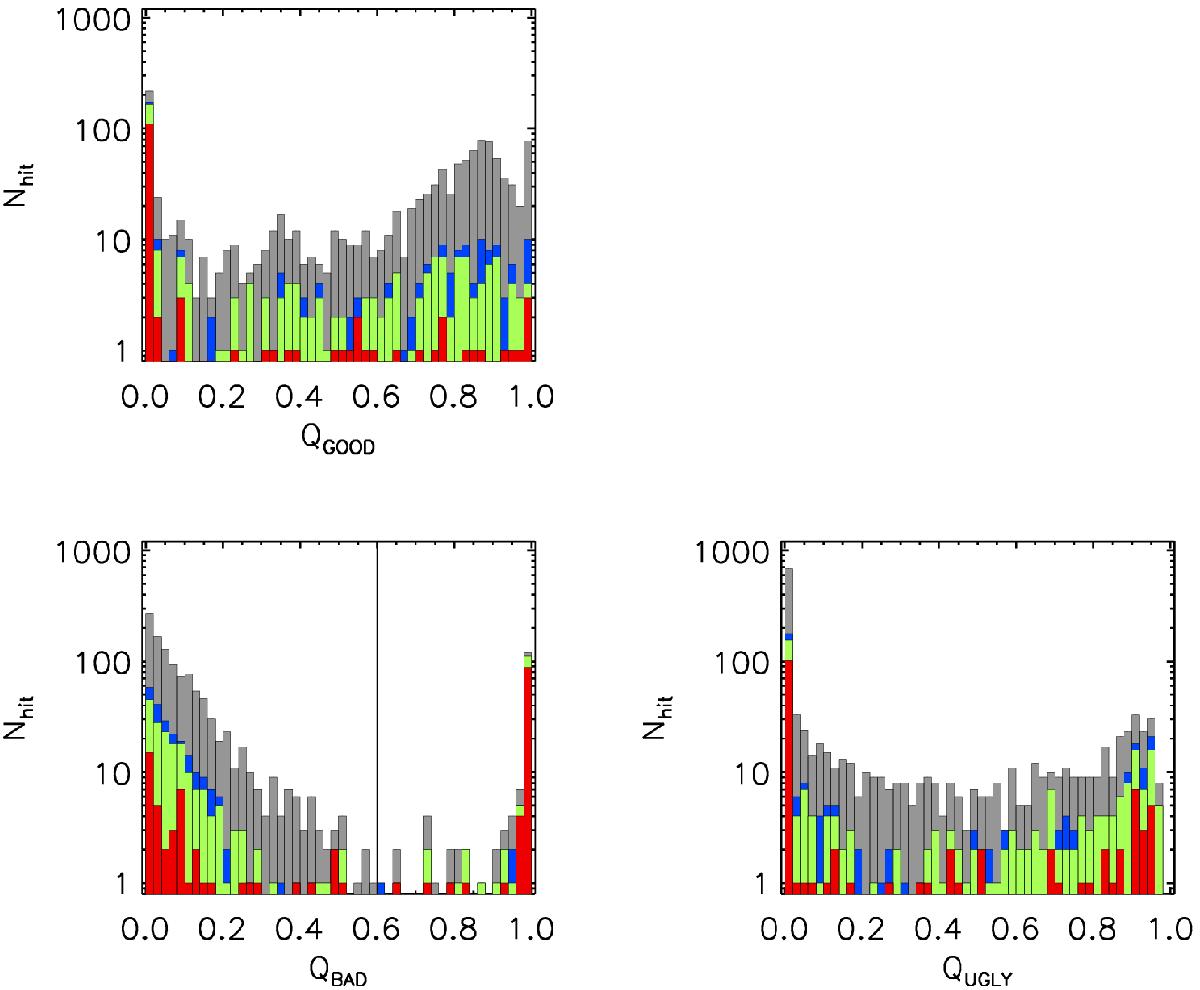
Distribution of neural-network-based estimation of the quality factor for the PSZ1 catalog (used as training or checking sets). Grey, blue, green, and red are for confirmed clusters, class 1, 2, and 3 sources, respectively. The vertical solid line shows the threshold Qbad = 0.6.
Current usage metrics show cumulative count of Article Views (full-text article views including HTML views, PDF and ePub downloads, according to the available data) and Abstracts Views on Vision4Press platform.
Data correspond to usage on the plateform after 2015. The current usage metrics is available 48-96 hours after online publication and is updated daily on week days.
Initial download of the metrics may take a while.