Free Access
Fig. 9
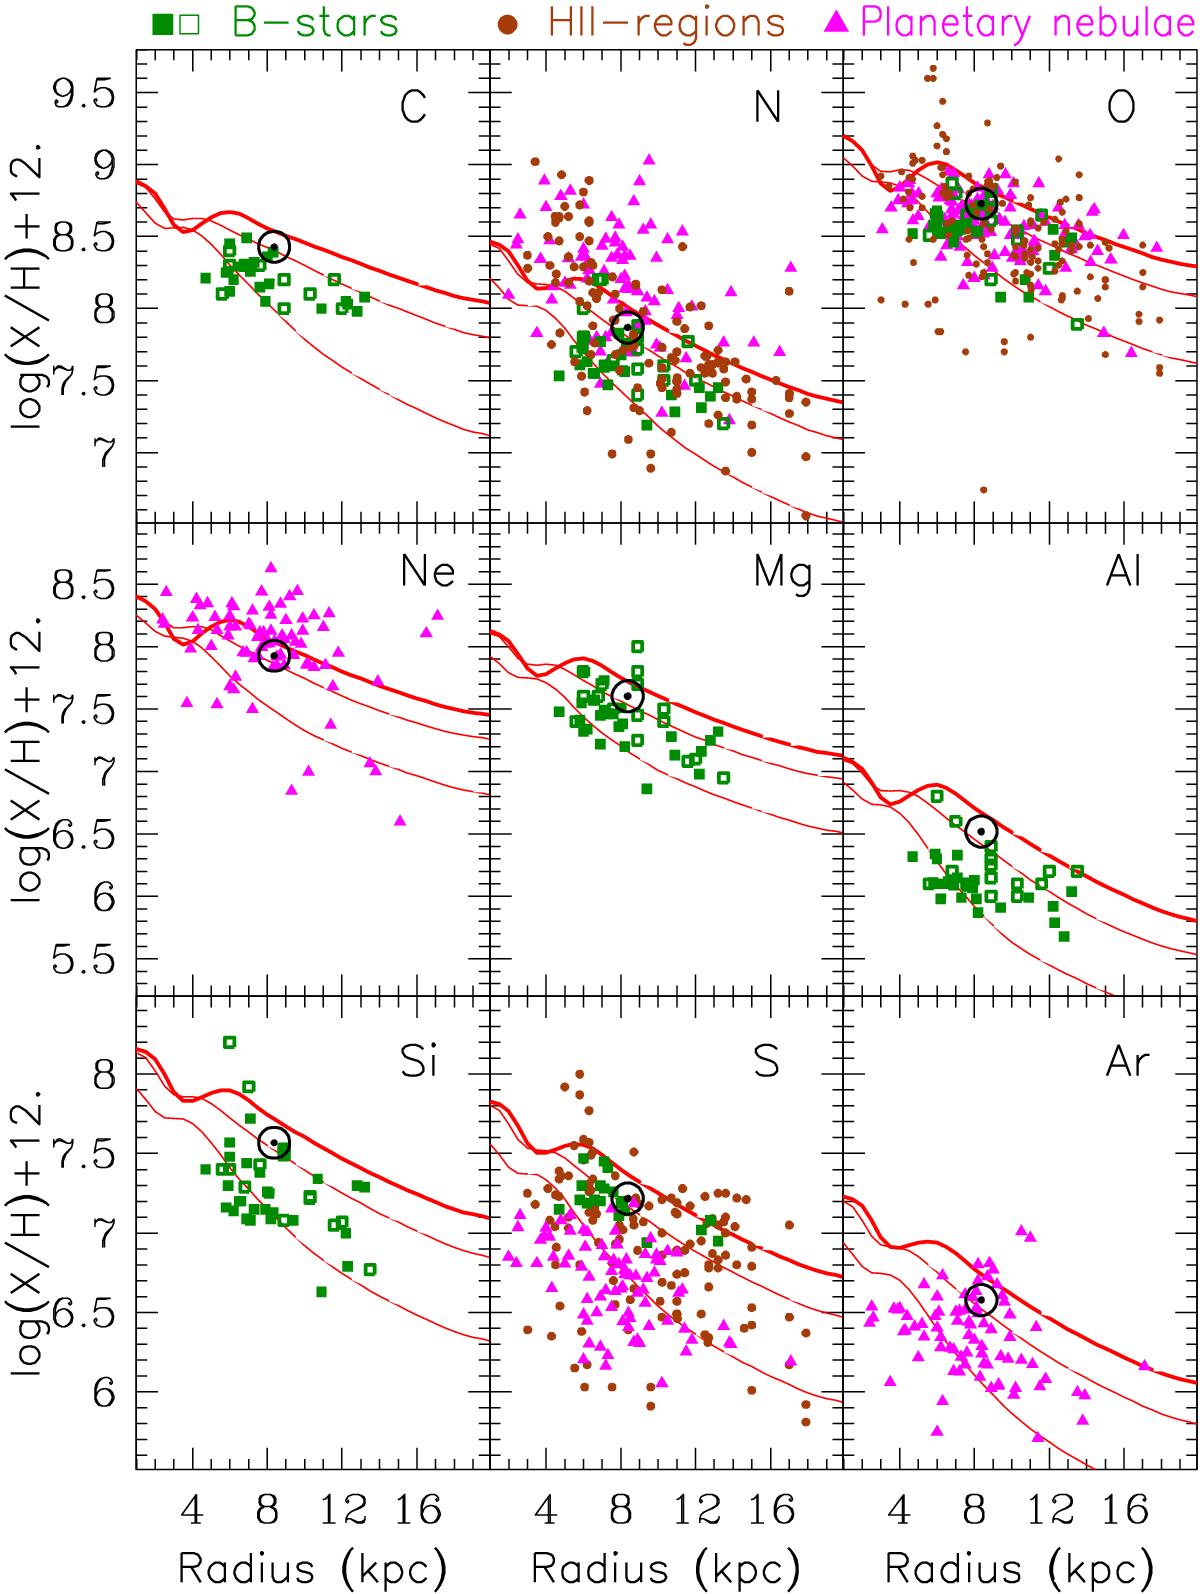
Abundance profiles from C to Ar and comparison to data from PN (magenta triangles), B-stars (green squares) and HII-regions (brown dots); data sources are provided in Table 1. Model curves correspond to gaseous profiles at time 4, 8 and 12 Gyr (thick), respectively.
Current usage metrics show cumulative count of Article Views (full-text article views including HTML views, PDF and ePub downloads, according to the available data) and Abstracts Views on Vision4Press platform.
Data correspond to usage on the plateform after 2015. The current usage metrics is available 48-96 hours after online publication and is updated daily on week days.
Initial download of the metrics may take a while.