Fig. 8
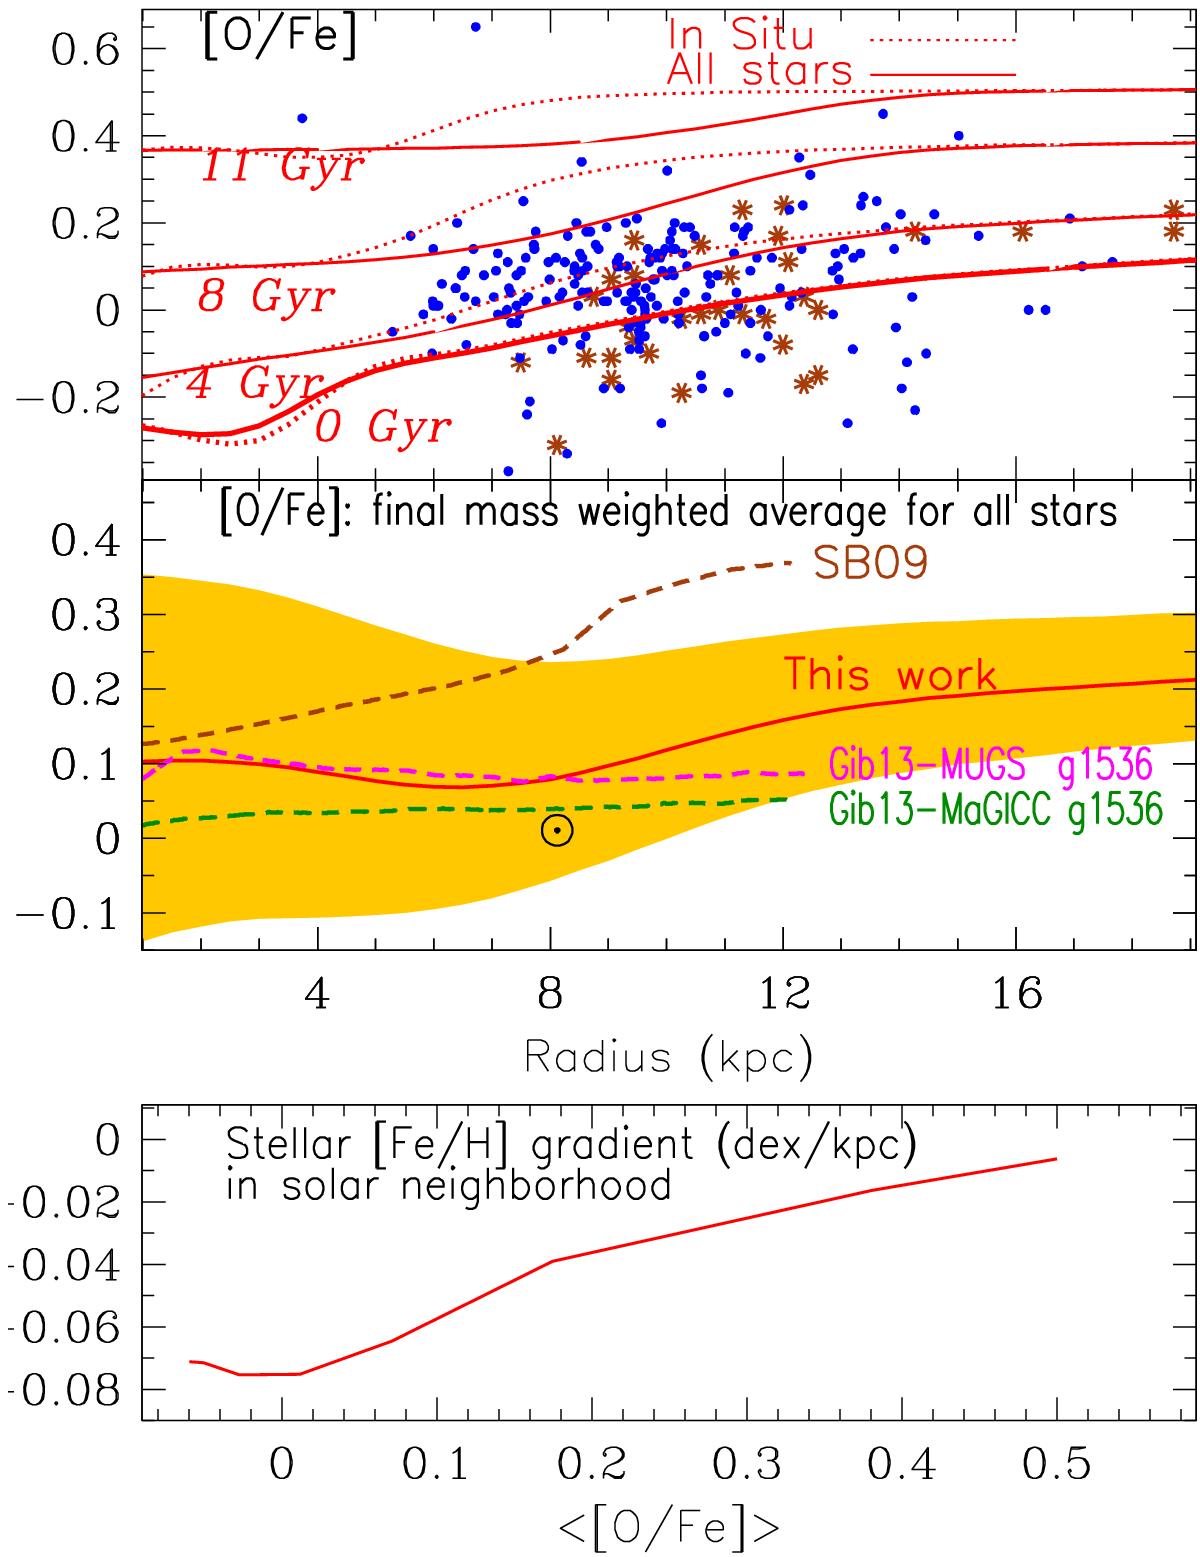
Top: evolution of the O/Fe profile. Data are for Cepheids (filled circles, from Luck & Lambert 2011) and for open clusters (Yong et al. 2012, asterisks and Frinchaboy et al. 2013, squares). Dotted curves correspond to model stars of average ages 11, 8, 4 and 0.2 Gyr (from top to bottom) formed in situ and solid curves to stellar populations of the same age found today at radius r. Middle: mass-weighted stellar [O/Fe] profile vs. radius. The solid red curve indicates our results and the shaded area the corresponding ±1σ range. The dashed curves are from Fig. 2 of Gibson et al. (2013) and indicate results of Schönrich & Binney (2009) and Gibson et al. (2013), the latter obtained with two different models (see text). Bottom: the stellar Fe/H gradient of stars found today in the region 5−11 kpc is plotted vs. the average [O/Fe] ratio of those stars (see text).
Current usage metrics show cumulative count of Article Views (full-text article views including HTML views, PDF and ePub downloads, according to the available data) and Abstracts Views on Vision4Press platform.
Data correspond to usage on the plateform after 2015. The current usage metrics is available 48-96 hours after online publication and is updated daily on week days.
Initial download of the metrics may take a while.