Fig. 7
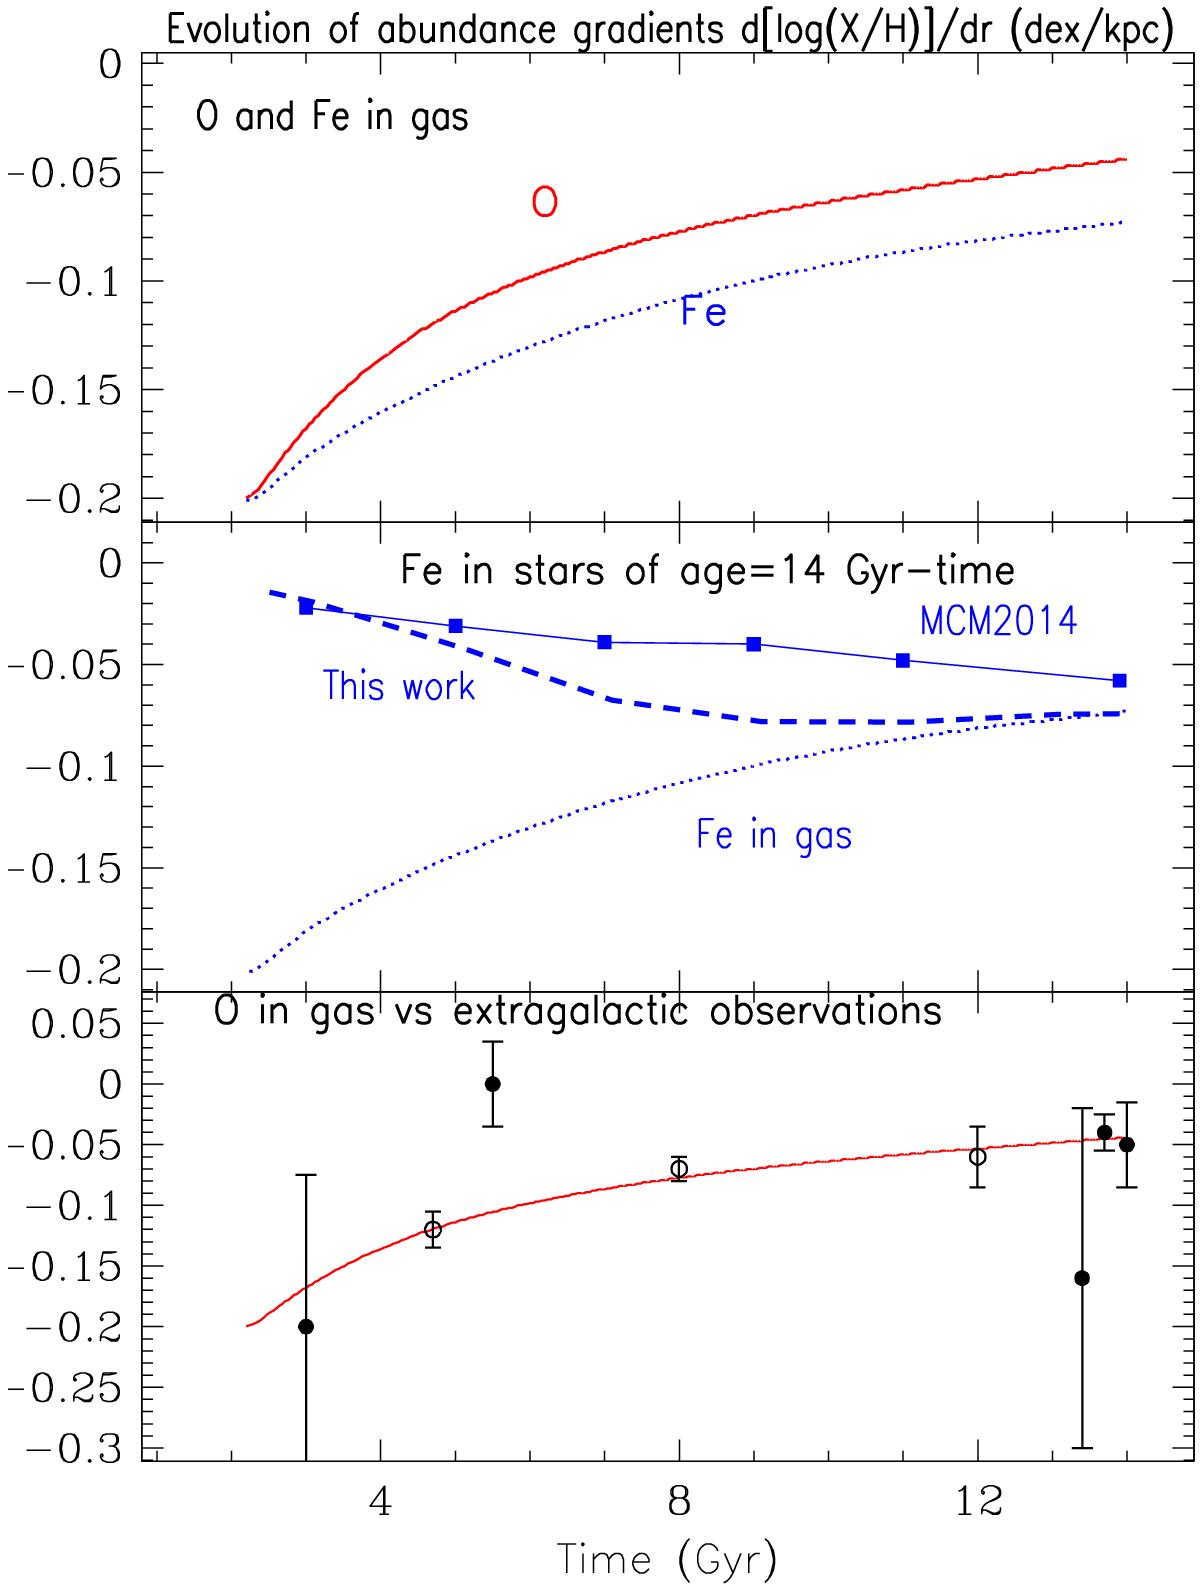
Top: evolution of the gaseous O and Fe abundance gradients. Middle: the evolution of the gaseous Fe gradient (dotted, same as in top panel) is compared to the evolution of the stellar Fe gradient, as it appears today after stellar migration (thick dashed). The squares, connected by solid segments represent the results of Minchev et al. (2014, their Table 2), for all stars found within distance Z< 3 kpc from the galactic plane. Bottom: the evolution of the O abundance gradient in the gas (same as in top panel) is compared to the extragalactic data compiled from Jones et al. (2013). The three open symbols correspond to an evaluation of MW data, which is superseded by the recent one of Maciel & Costa (2013), who find no clear indications for any evolution of the abundance gradient.
Current usage metrics show cumulative count of Article Views (full-text article views including HTML views, PDF and ePub downloads, according to the available data) and Abstracts Views on Vision4Press platform.
Data correspond to usage on the plateform after 2015. The current usage metrics is available 48-96 hours after online publication and is updated daily on week days.
Initial download of the metrics may take a while.