Fig. 5
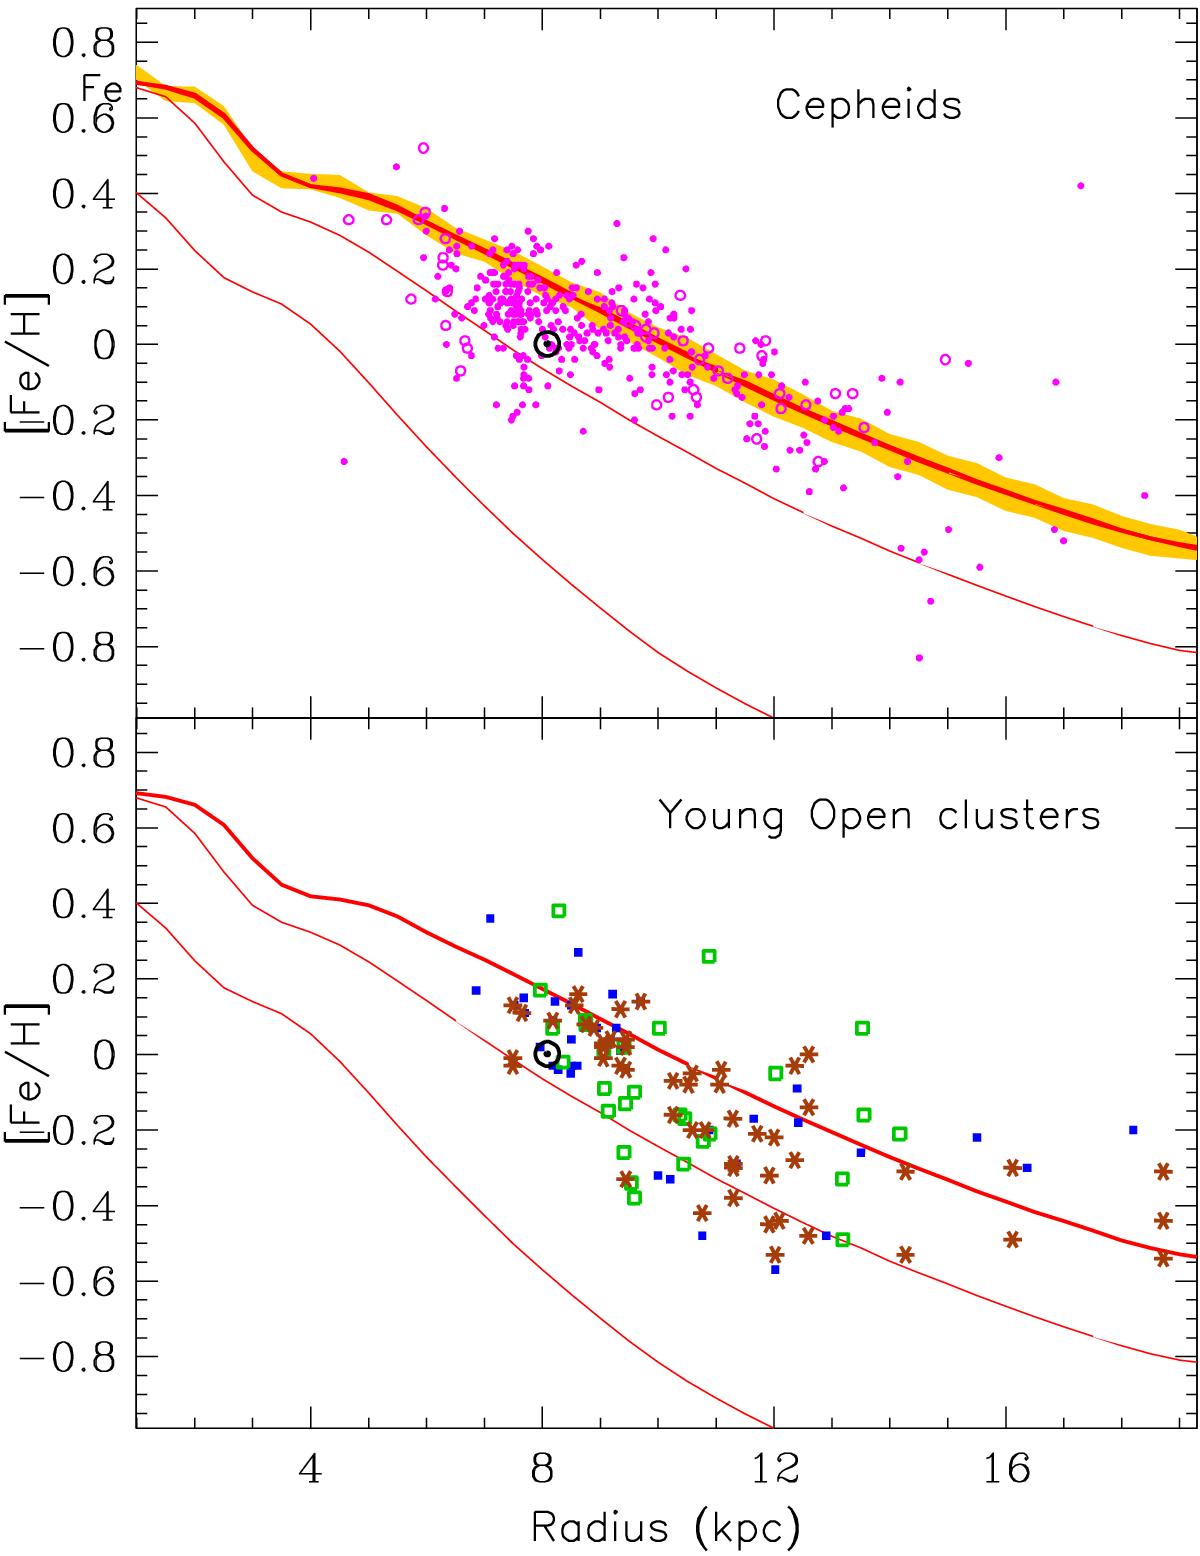
Iron abundance profiles of Cepheids (top) and open clusters (bottom). Data sources are provided in Table 1. Symbols in the upper panel correspond to Ref. 3 and in the lower panel to Refs. 9 (blue filled squares), 10 (brown asterisks) and 11 (green open squares), respectively. Curves corespond to model results at time 4, 8 and 12 Gyr (thick curve), respectively). The thick red curve in the top panel corresponds to the average metallicity of a young stellar population of age 0.2 ± 0.2 Gyr (Cepheids) and the shaded aerea represents the corresponding ±1σ dispersion.
Current usage metrics show cumulative count of Article Views (full-text article views including HTML views, PDF and ePub downloads, according to the available data) and Abstracts Views on Vision4Press platform.
Data correspond to usage on the plateform after 2015. The current usage metrics is available 48-96 hours after online publication and is updated daily on week days.
Initial download of the metrics may take a while.