Fig. 4
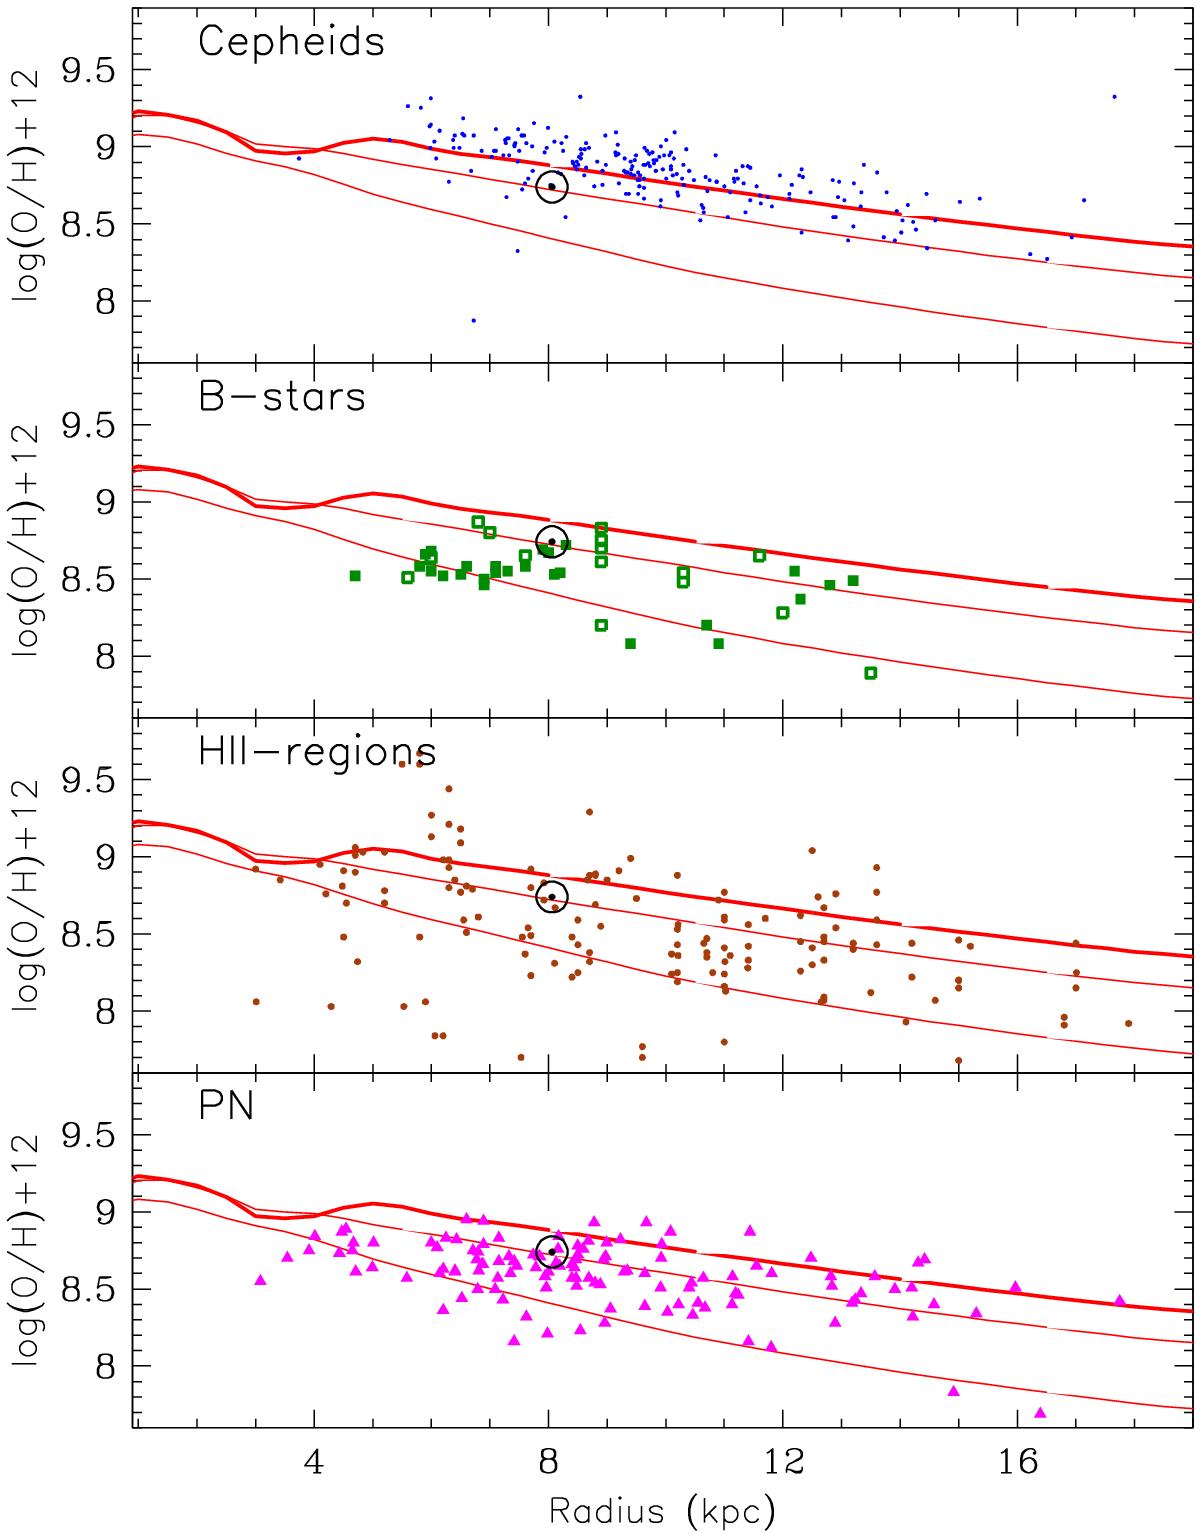
Oxygen abundance profiles of Cepheids, B-stars, HII regions, and planetary nebulae (PN); data sources are in Table 1. The adopted solar value of log (O / H) + 12 = 8.73 is from Asplund et al. (2009). Model curves (from bottom to top, in all panels) represent the gaseous abundance profile at times 4, 8 and 12 Gyr (thick curve), respectively.
Current usage metrics show cumulative count of Article Views (full-text article views including HTML views, PDF and ePub downloads, according to the available data) and Abstracts Views on Vision4Press platform.
Data correspond to usage on the plateform after 2015. The current usage metrics is available 48-96 hours after online publication and is updated daily on week days.
Initial download of the metrics may take a while.