Fig. 3
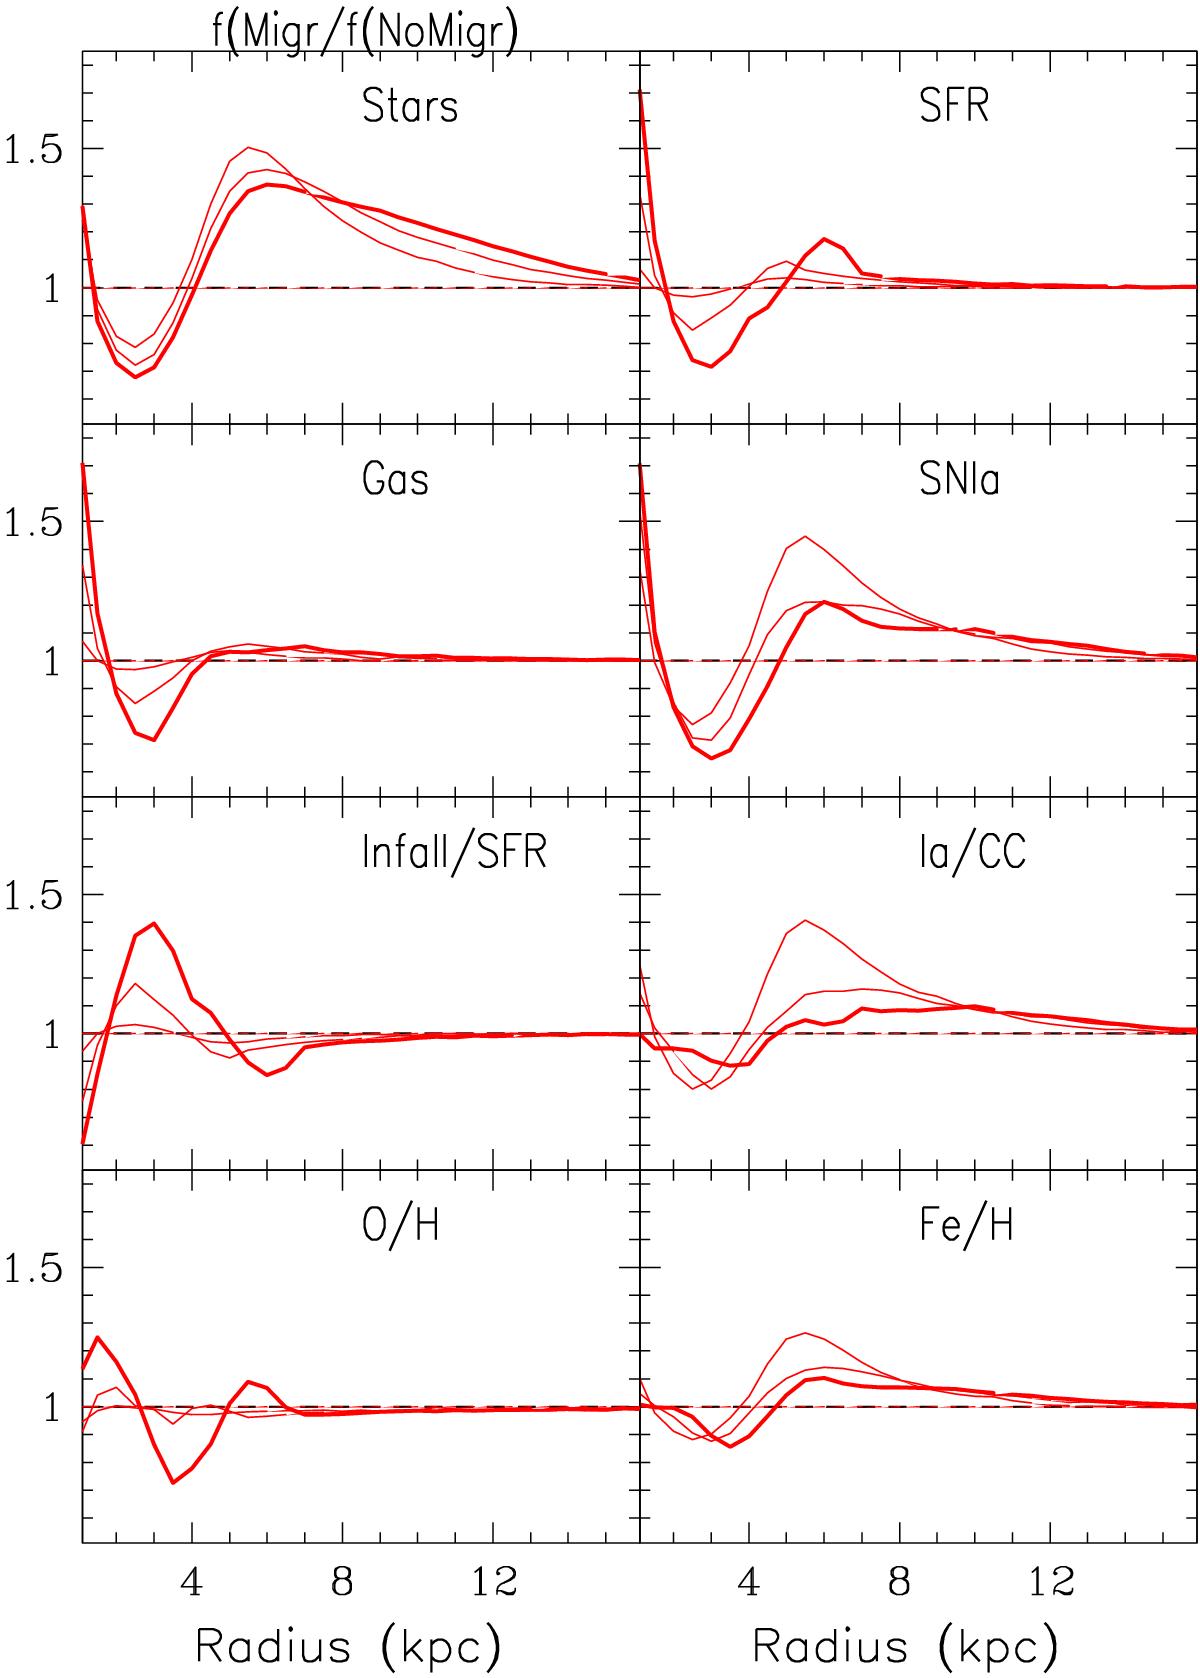
Top: comparison of various properties of our model, expressed as the ratio of a given quantity in the case of radial migration to the same quantity when stars do not migrate. From top to bottom, left: star surface density, gas surface density, gas fraction, O/H profile; right: SFR surface density, SNIa rate, ratio of SNIa/CCSN, Fe/H profile. In all panels, thick curves represent results at 12 Gyr and thin curves at 8 and 4 Gyr, respectively (as in Fig. 1).
Current usage metrics show cumulative count of Article Views (full-text article views including HTML views, PDF and ePub downloads, according to the available data) and Abstracts Views on Vision4Press platform.
Data correspond to usage on the plateform after 2015. The current usage metrics is available 48-96 hours after online publication and is updated daily on week days.
Initial download of the metrics may take a while.