Free Access
Fig. 10
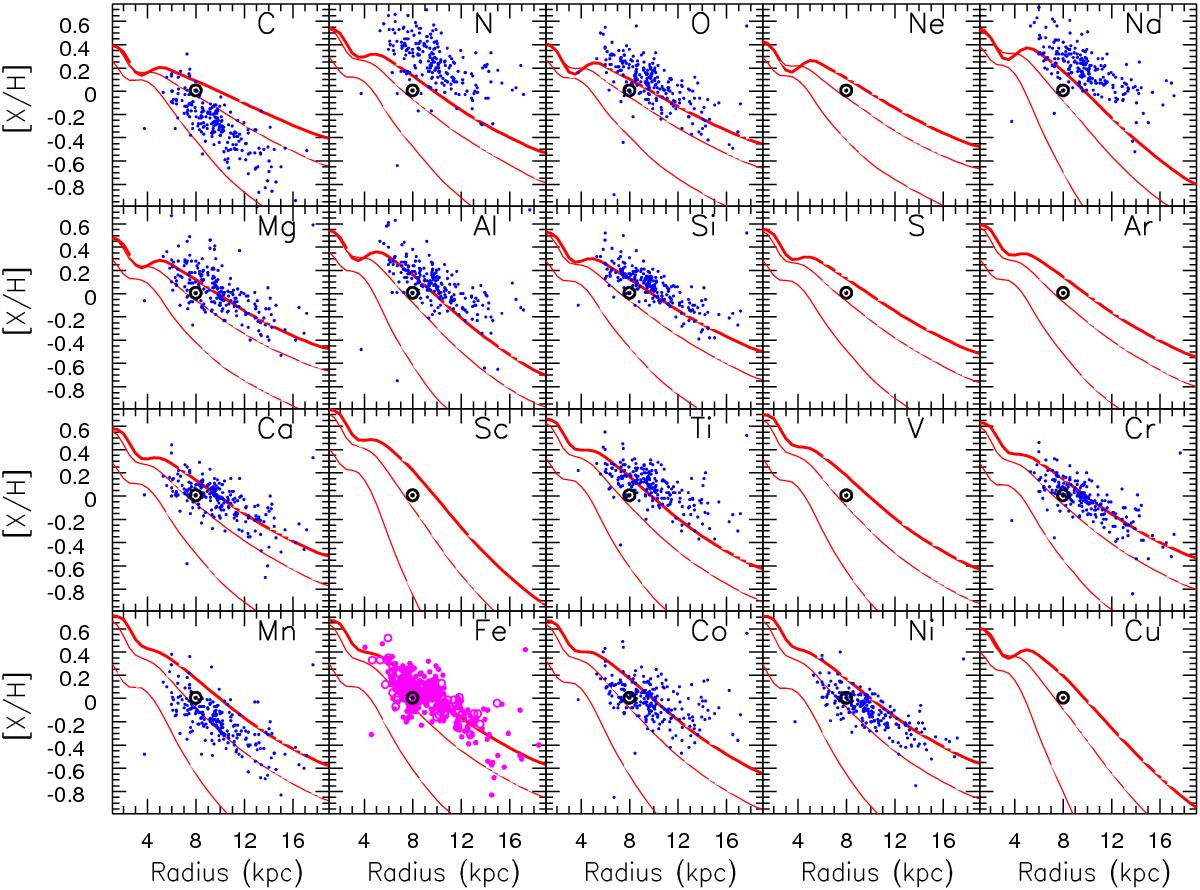
Abundance profiles from C to Zn and comparison to Cepheid data (from Luck & Lambert 2011; except for Fe data, provided in Genovali et al. 2014). Model curves correspond to the gaseous profiles after 4, 8 and 12 (thick curve) Gyr, respectively.
Current usage metrics show cumulative count of Article Views (full-text article views including HTML views, PDF and ePub downloads, according to the available data) and Abstracts Views on Vision4Press platform.
Data correspond to usage on the plateform after 2015. The current usage metrics is available 48-96 hours after online publication and is updated daily on week days.
Initial download of the metrics may take a while.