Fig. 1
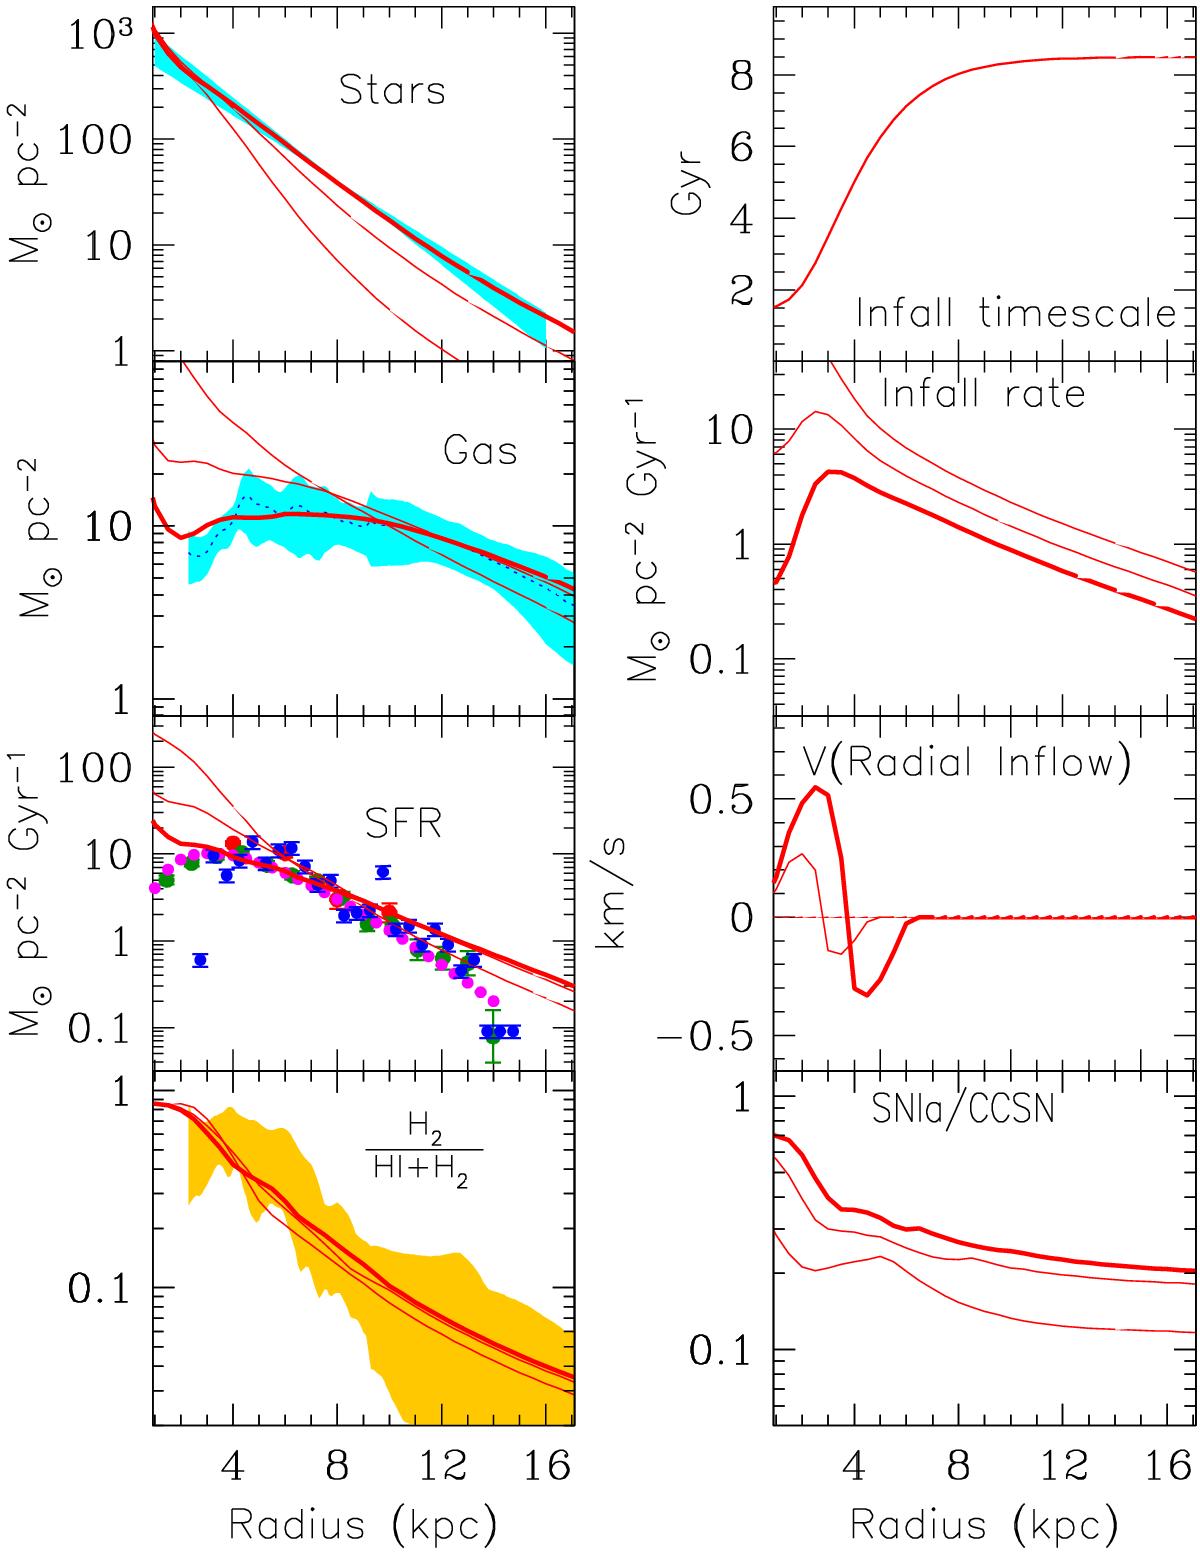
Left (from top to bottom): model profiles of stars, gas, SFR and molecular gas fraction fMol at 4, 8 (thin curves) and 12 Gyr (thick curve). The curve at 12 Gyr is compared to observational data for the present-day profiles of the correspoding quantities (shaded aereas for the stars, gas and fMol and points with error bars for the SFR); data sources are provided in KPA15. Right (from top to bottom): infall timescales, infall rates, velocity profiles of radial inflow (positive values towards the Galactic centre), ratio of SNIa/CCSN; in all panels but the top one, the three curves correspond to 4, 8 and 12 Gyr (thickest curve).
Current usage metrics show cumulative count of Article Views (full-text article views including HTML views, PDF and ePub downloads, according to the available data) and Abstracts Views on Vision4Press platform.
Data correspond to usage on the plateform after 2015. The current usage metrics is available 48-96 hours after online publication and is updated daily on week days.
Initial download of the metrics may take a while.