Fig. 9
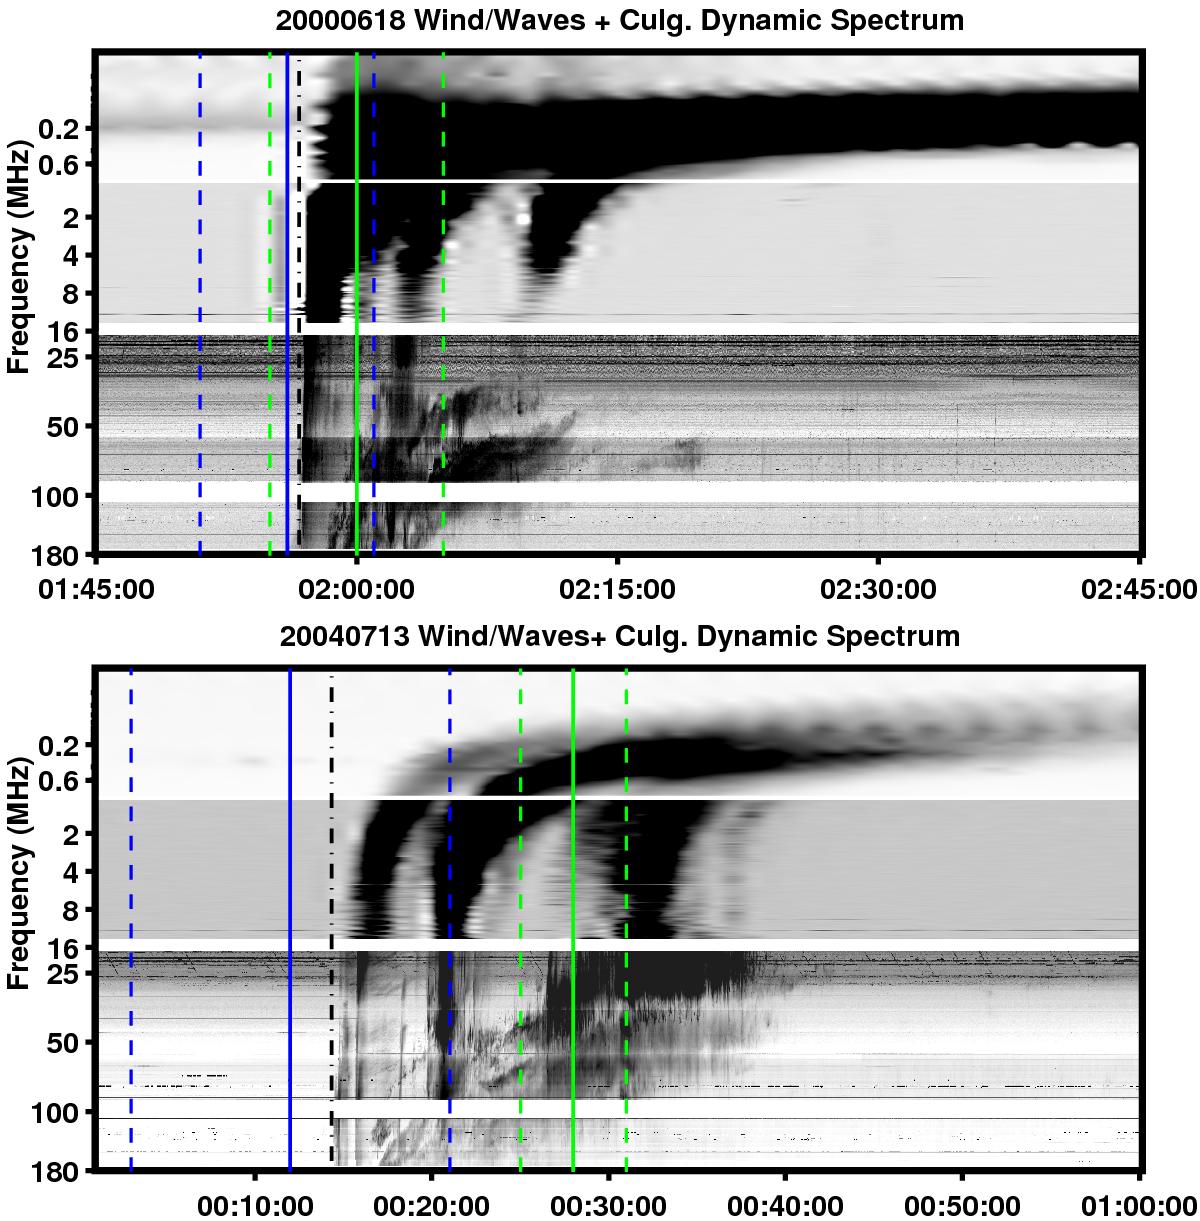
Composite radio spectra for two different electron events. Top: event of 18 June 2000. Bottom: event of 13 July 2004. With the vertical blue line and dashed lines we present the proton release time derived from the VDA analysis and its uncertainty, respectively; with the vertical green line and dashed lines we present the electron release time derived from the VDA analysis and its uncertainty, respectively; with the black dash-dotted line, we present the start of the type III burst.
Current usage metrics show cumulative count of Article Views (full-text article views including HTML views, PDF and ePub downloads, according to the available data) and Abstracts Views on Vision4Press platform.
Data correspond to usage on the plateform after 2015. The current usage metrics is available 48-96 hours after online publication and is updated daily on week days.
Initial download of the metrics may take a while.