Fig. 8
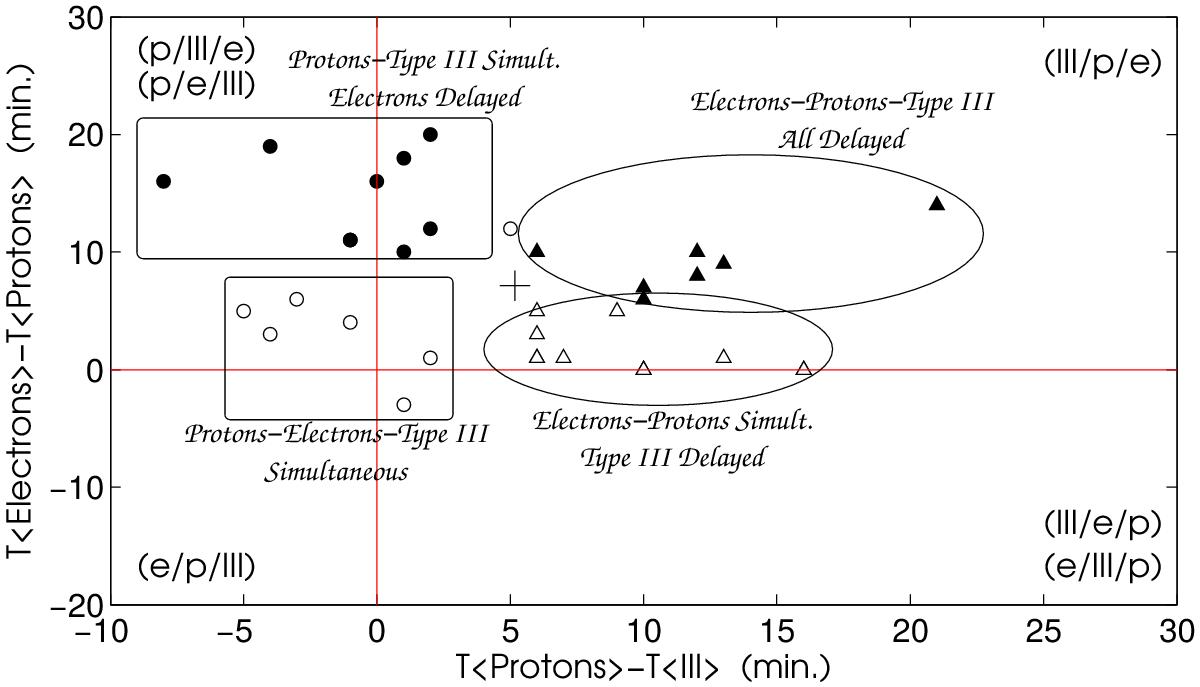
Scatter plot of the proton-type-III time difference versus the electron-proton time difference. We use circles for the proton-type-III simultaneously released events and triangles for the delayed events. For the proton-electron release, we use unfilled markers for the simultaneously released events, and black-filled markers for the delayed events. The small black cross represents the point of the mean value for each time difference. We used the red horizontal and vertical lines to separate the scatter plot into categories according to the labelled cases (i.e. III/p/e, III/e/p, e/III/p, p/III/e, p/e/III, e/p/III). We label the four resulting groups, as derived from the separation, into simultaneously released and delayed events; we use rectangles and ellipses only for illustration purposes.
Current usage metrics show cumulative count of Article Views (full-text article views including HTML views, PDF and ePub downloads, according to the available data) and Abstracts Views on Vision4Press platform.
Data correspond to usage on the plateform after 2015. The current usage metrics is available 48-96 hours after online publication and is updated daily on week days.
Initial download of the metrics may take a while.