Fig. 2
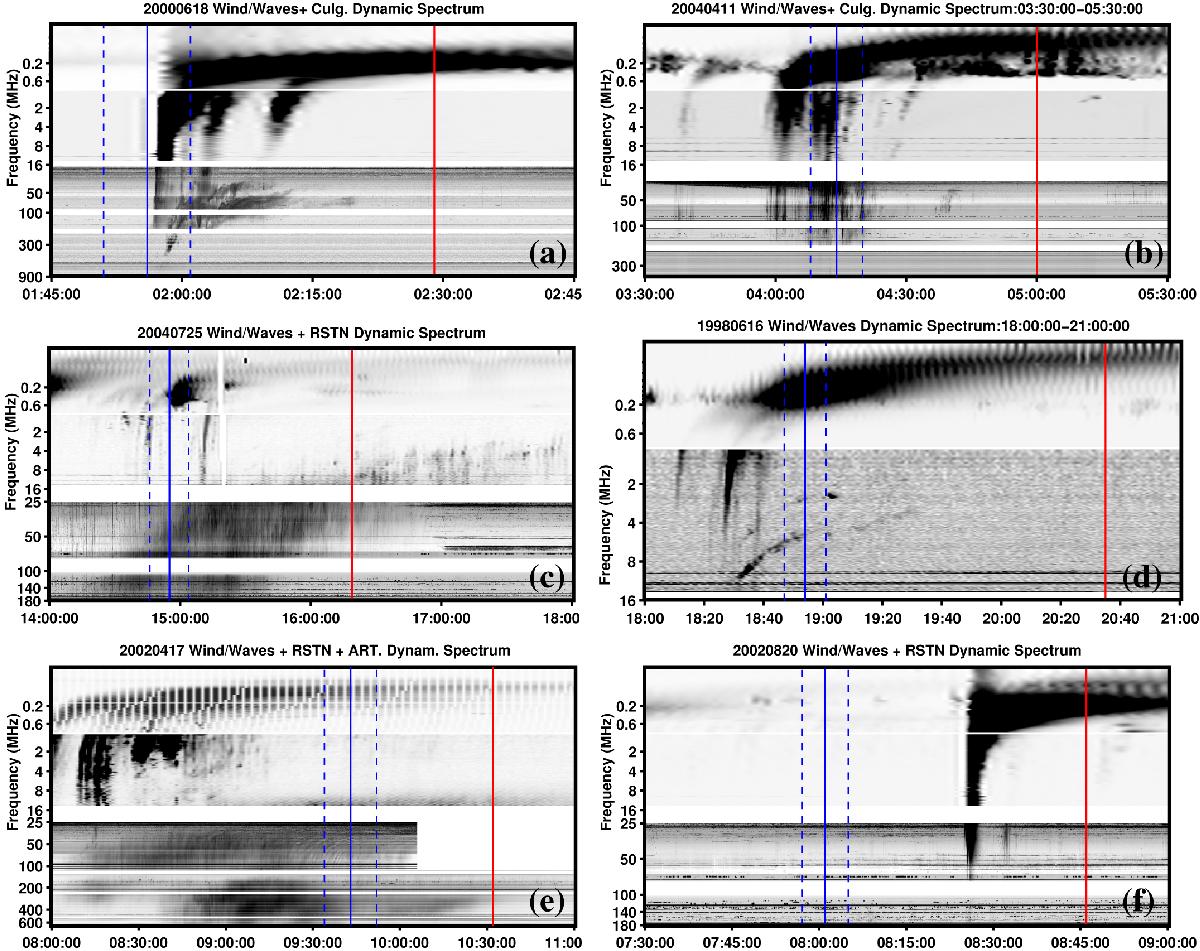
Radio spectra for different radio-associated cases: a) event of 18 June 2000 with type III/II radio association; b) event of 11 April 2004 with type III association; c) event of 25 July 2004 with type III/IV-c association; d) event of 16 June 1998 with type II association; e) event of 17 April 2002 with type IV-c association; and f) event of 20 August 2002 with “no inferred” radio association. In each panel, the vertical lines have the same meaning as in Fig. 1.
Current usage metrics show cumulative count of Article Views (full-text article views including HTML views, PDF and ePub downloads, according to the available data) and Abstracts Views on Vision4Press platform.
Data correspond to usage on the plateform after 2015. The current usage metrics is available 48-96 hours after online publication and is updated daily on week days.
Initial download of the metrics may take a while.