Fig. A.1
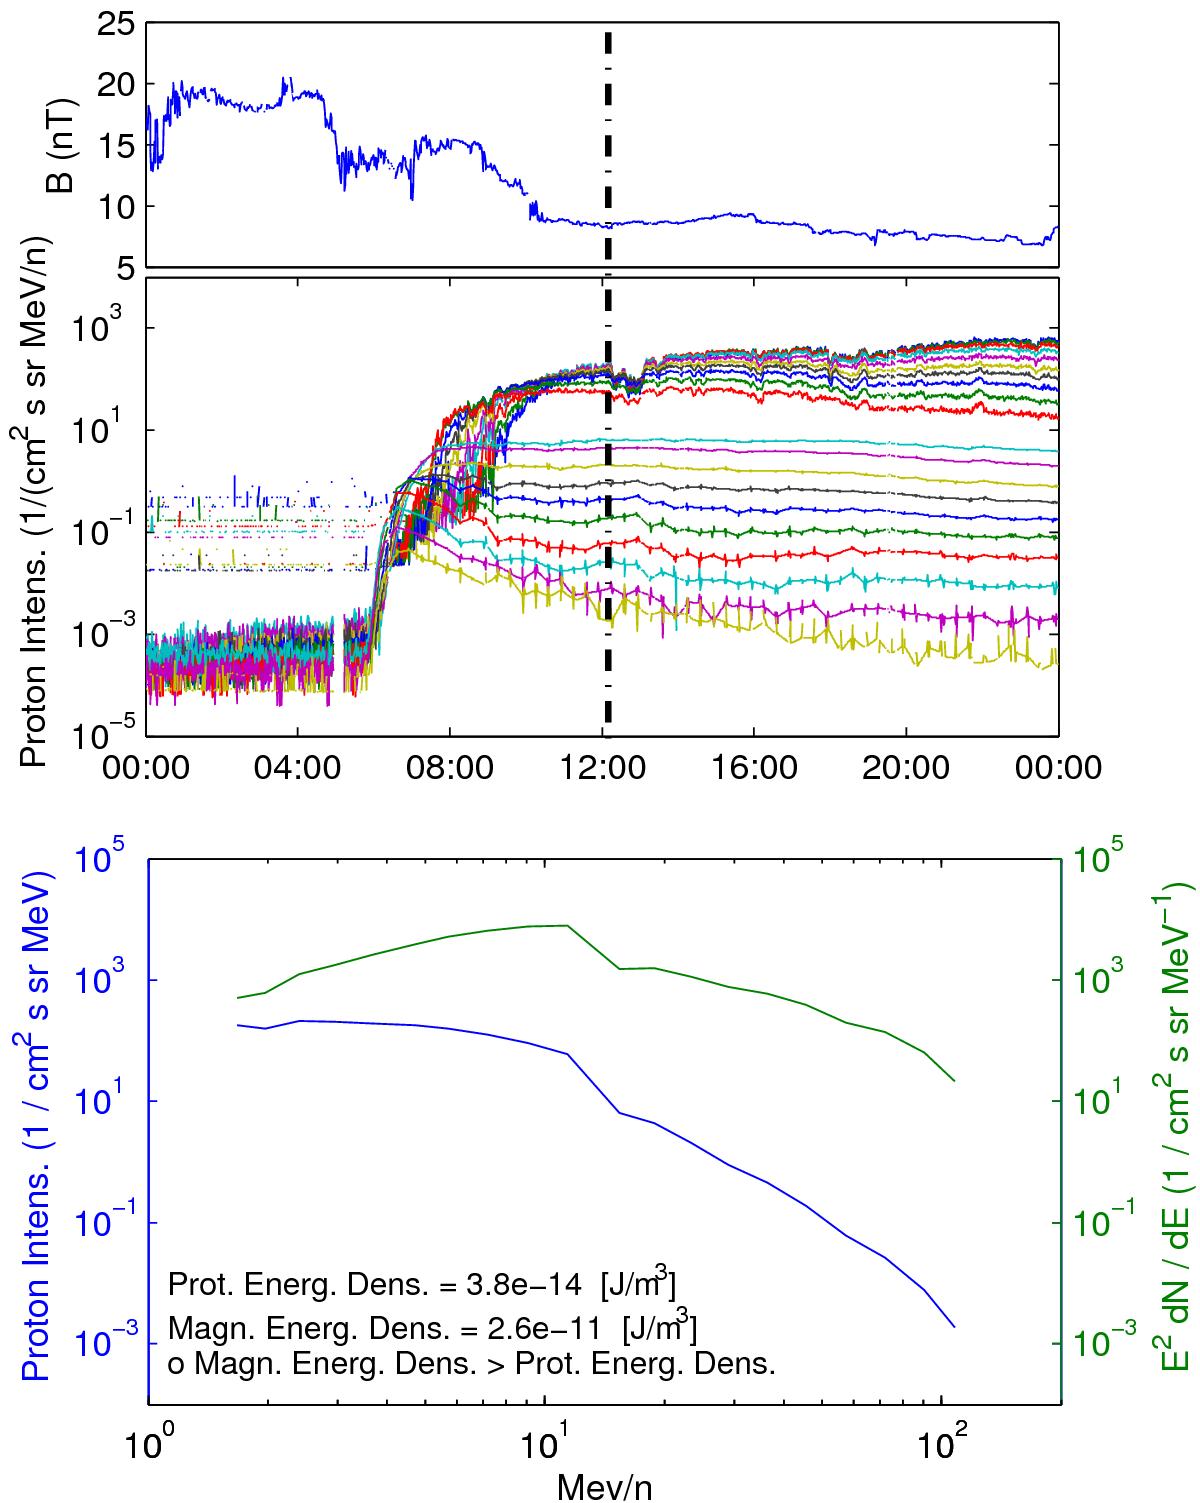
Data for the calculation of the proton and magnetic energy density for the SEP event of 26 December 2001 at 12:10 UT. Top: average of the magnetic field vector from Wind/IMF. Middle: proton intensity in 20 energy channels of SOHO/ERNE. The vertical black dash-dotted line marks the time of the energy density calculation. Bottom: proton energy spectrum in logarithmic scale at 12:10 UT shown with a blue line and the measure of E2dN/ dE shown with a green line.
Current usage metrics show cumulative count of Article Views (full-text article views including HTML views, PDF and ePub downloads, according to the available data) and Abstracts Views on Vision4Press platform.
Data correspond to usage on the plateform after 2015. The current usage metrics is available 48-96 hours after online publication and is updated daily on week days.
Initial download of the metrics may take a while.