Fig. 1
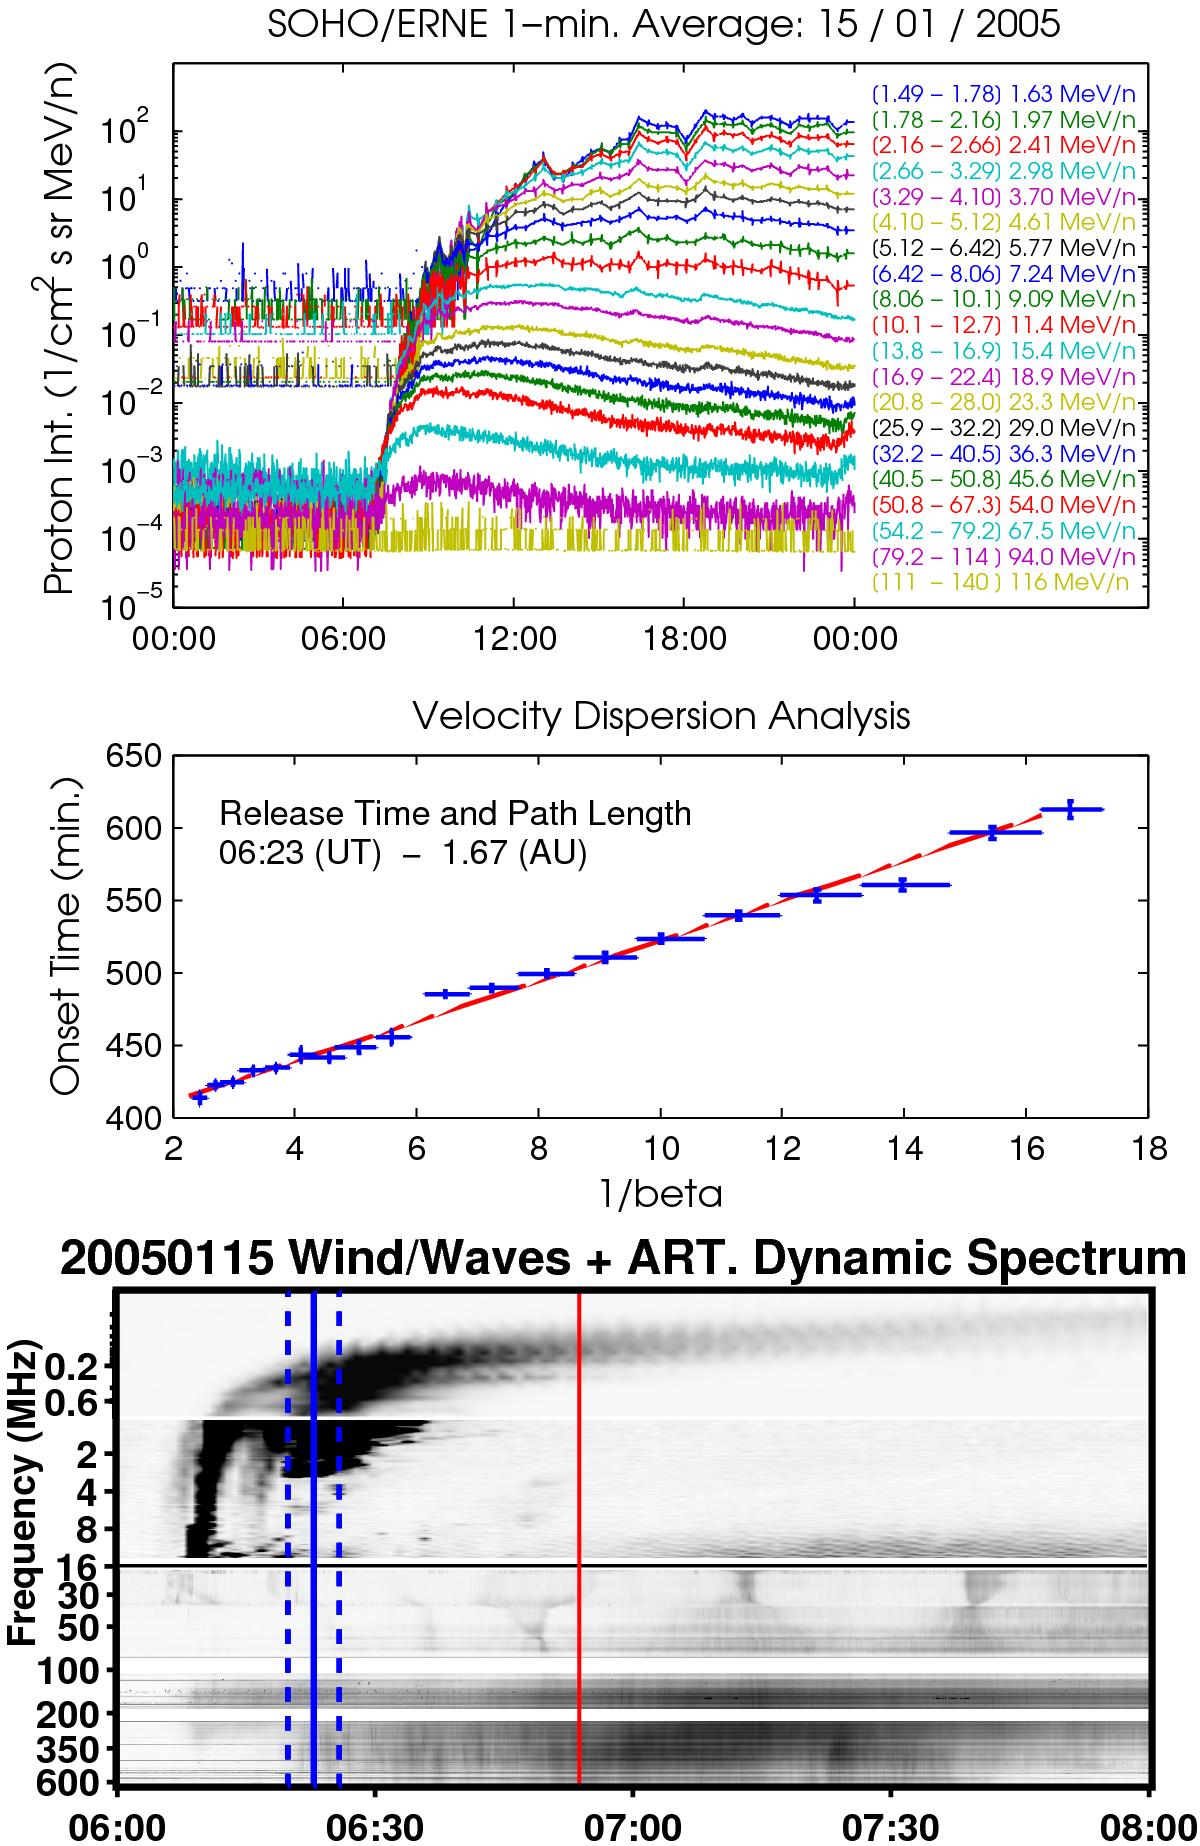
Proton event of 15 January 2005: top: proton intensity as recorded from SOHO/ERNE for 20 proton energy channels between 1.58 MeV and 131 MeV. Middle: proton velocity dispersion analysis from the SOHO/ERNE data. We mark the proton onset times in the individual energy channels with blue crosses, the horizontal error bar represents the uncertainty of the particles’ inverse velocity, which is determined from the width of every energy channel and the vertical error bar represents the uncertainty of the onset time determination derived from the Monte Carlo analysis. With the straight red line we present the linear fit to the onset times using the maximum likelihood estimation approach. Bottom: composite radio spectra of Wind/waves and ARTEMIS-IV. The vertical blue solid line and dashed lines denote the proton release time derived from the VDA and its uncertainty, respectively; the red line denotes the onset time of 54.8–80.3 MeV protons.
Current usage metrics show cumulative count of Article Views (full-text article views including HTML views, PDF and ePub downloads, according to the available data) and Abstracts Views on Vision4Press platform.
Data correspond to usage on the plateform after 2015. The current usage metrics is available 48-96 hours after online publication and is updated daily on week days.
Initial download of the metrics may take a while.