Free Access
Fig. 1
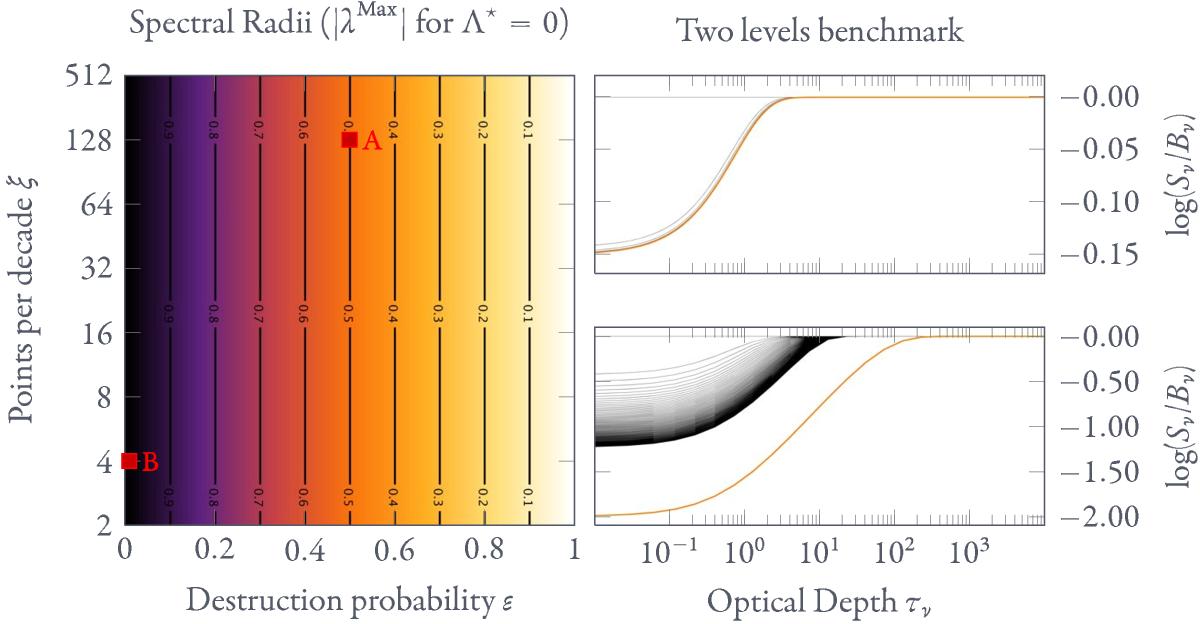
Spectral radius of amplification matrix for the Λ iteration method. Convergence is shown for two spectral radii, marked with letters A (upper panel) and B (lower panel) in the right-hand panels. The thin black lines correspond to successive iterations; the true solution is given by the orange line.
Current usage metrics show cumulative count of Article Views (full-text article views including HTML views, PDF and ePub downloads, according to the available data) and Abstracts Views on Vision4Press platform.
Data correspond to usage on the plateform after 2015. The current usage metrics is available 48-96 hours after online publication and is updated daily on week days.
Initial download of the metrics may take a while.