Fig. 3
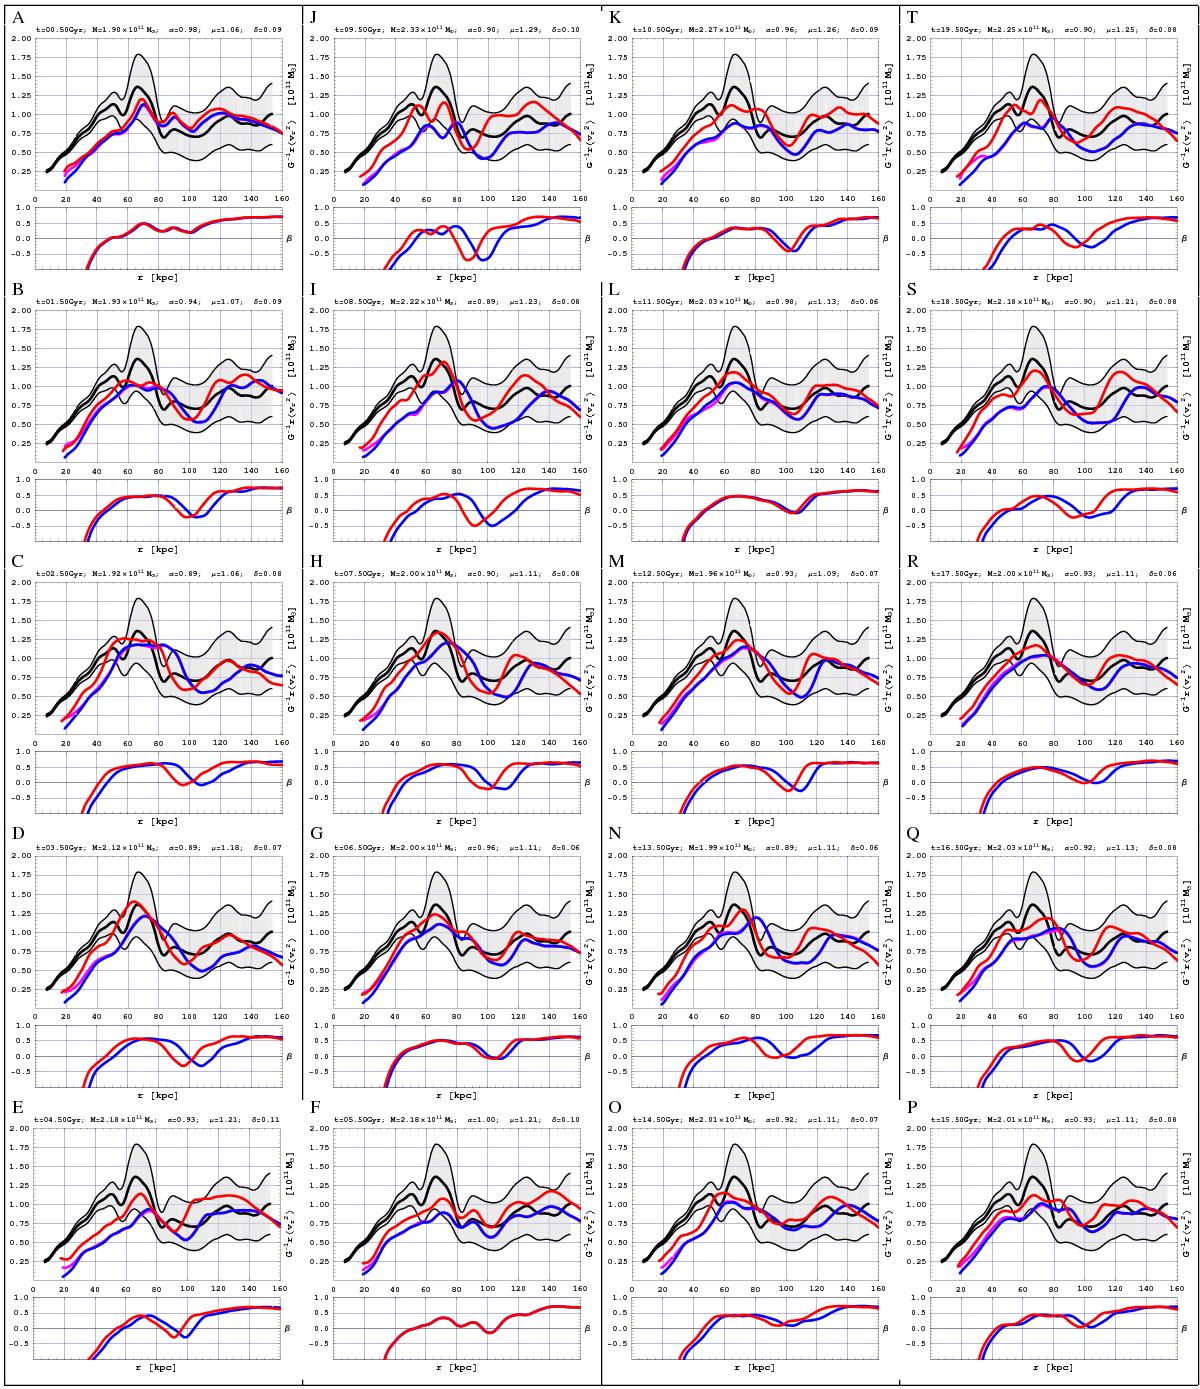
A sequence A,B,...S,T of simulated RVD models shown at distinct simulation instants with red lines. The models were obtained from the blue line RVD (evolved from the initial PDF in the Ψdisk + Ψgas potential of total mass Mref) by rescaling the horizontal and vertical directions so as to overlap with the black line reference RVD (from measurements) as good as possible. The blue line PDF does not differ much from the violet line PDF, which assumes β = 0. The light gray region is the RVD uncertainty defined by the vertical bars in Fig. 1. The bottom figure in each panel shows a β(r) profile corresponding to its respective RVD model. The decrease in β(r) towards negative values in the lower radii region r< 40 kpc is a model artifact discussed in the text.
Current usage metrics show cumulative count of Article Views (full-text article views including HTML views, PDF and ePub downloads, according to the available data) and Abstracts Views on Vision4Press platform.
Data correspond to usage on the plateform after 2015. The current usage metrics is available 48-96 hours after online publication and is updated daily on week days.
Initial download of the metrics may take a while.