Fig. 2
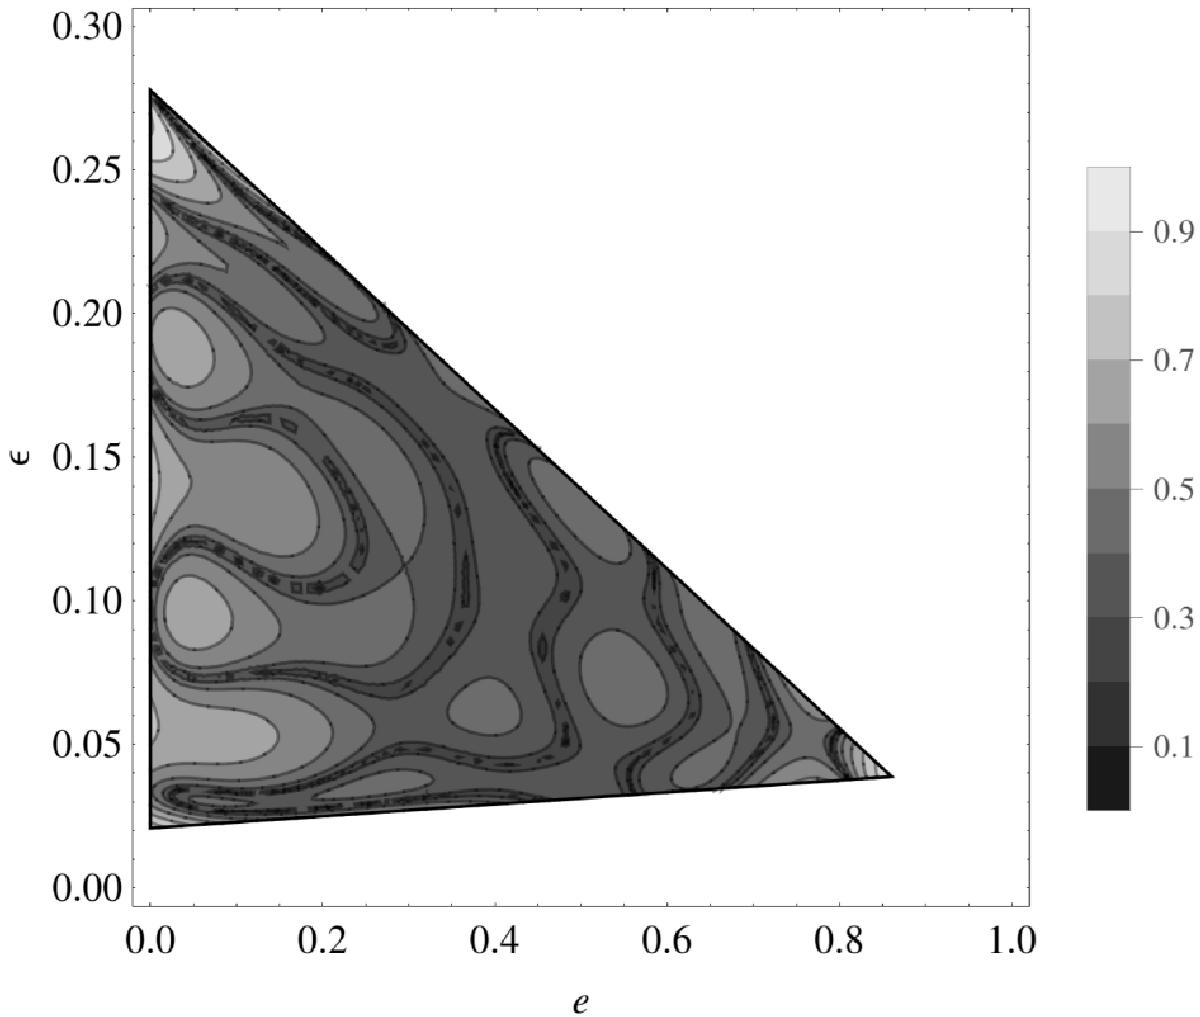
A distribution function f(e,ϵ) consistent with the RVD profile shown in Fig. 1. The function was obtained with the help of the Keplerian ensemble method, assuming Mref = 1.8 × 10¹¹ M⊙, Rua = 18 kpc, and Rub = 240 kpc. The contour plot shows (f(e,ϵ) /fS)1 / 10, with fS being the maximum value of f(e,ϵ) on the triangular domain.
Current usage metrics show cumulative count of Article Views (full-text article views including HTML views, PDF and ePub downloads, according to the available data) and Abstracts Views on Vision4Press platform.
Data correspond to usage on the plateform after 2015. The current usage metrics is available 48-96 hours after online publication and is updated daily on week days.
Initial download of the metrics may take a while.