Fig. 4
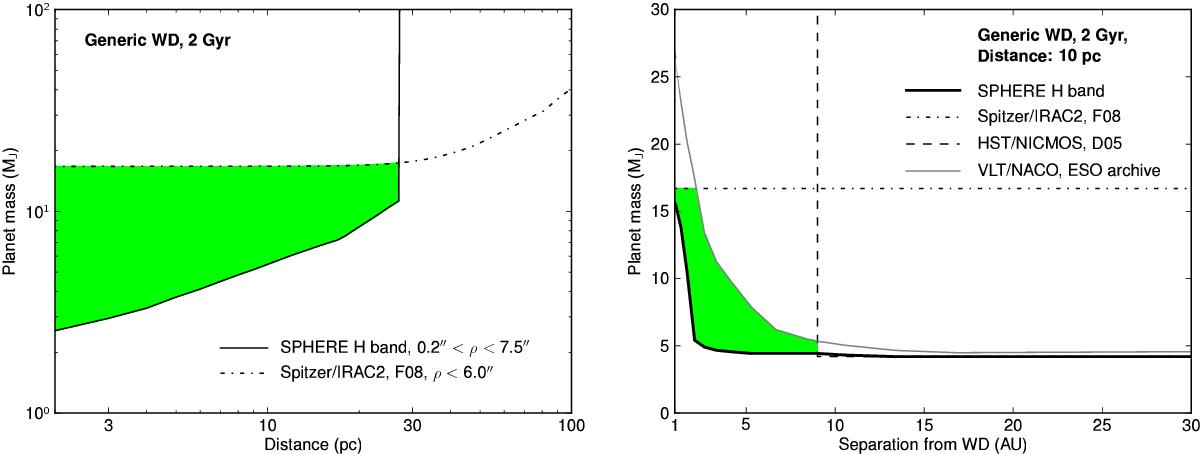
Illustration of the performance of SPHERE compared to other instruments for a typical nearby white dwarf (age 2 Gyr, MV = MH = 12). The green regions represent the parameter space for which SPHERE enables significant improvement over the other instruments. Left: sensitivity vs. distance of the white dwarf from the Sun. The quantity ρ represents the angular separation that the instrument is sensitive to. The performance of SPHERE is extrapolated from our observation of GD 50. Because GD 50 is at the faintness limit, the actual performance on a brighter target would be better. The vertical cut-off in the SPHERE curve near 30 pc is artificial and assumes that a star fainter than mV = 14.5 cannot be observed because of the limiting magnitude of the AO. For nearby bright white dwarfs, resolved imaging is more sensitive to low-mass objects than photometric observations. Right: contrast curves for the same WD at a distance of 10 pc. The NACO curve is estimated from archival data (program ID: 079.D-0561(A), PI: Radiszcz) with a similar integration time as SPHERE (3000 s). The HST/NICMOS limit was extrapolated from Debes et al. (2005b) with a typical exposure time of 20 min. The key point is that SPHERE has the unique capability to detect high-mass planets at 2−10 au from the white dwarf, which is not possible with any other instrument.
Current usage metrics show cumulative count of Article Views (full-text article views including HTML views, PDF and ePub downloads, according to the available data) and Abstracts Views on Vision4Press platform.
Data correspond to usage on the plateform after 2015. The current usage metrics is available 48-96 hours after online publication and is updated daily on week days.
Initial download of the metrics may take a while.