Fig. 1
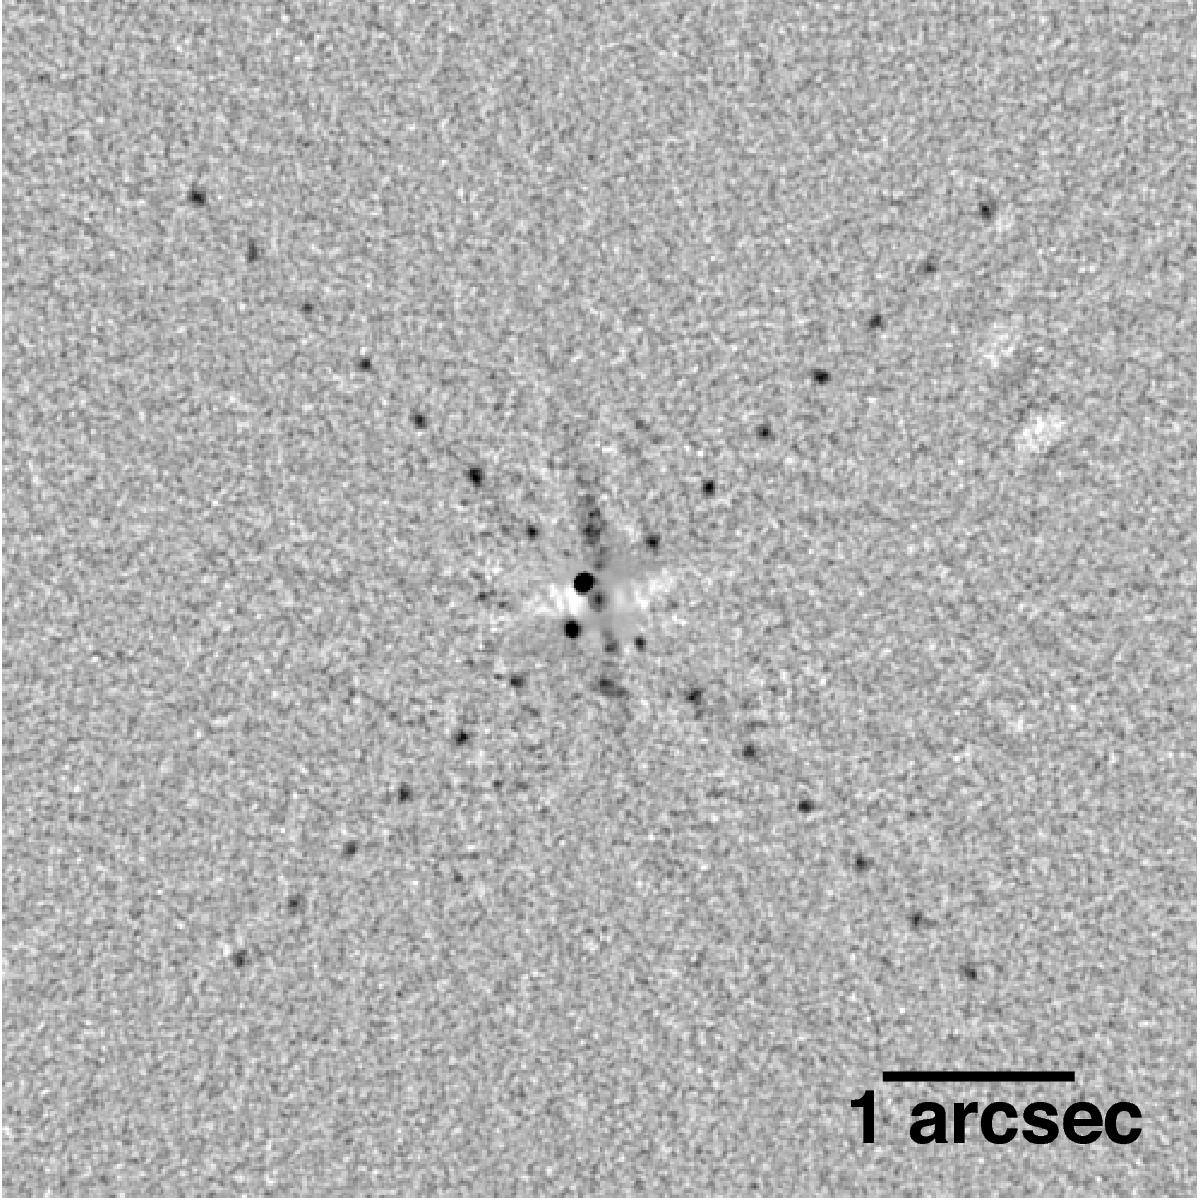
Signal-to-noise map (i.e., reduced image divided by a noise map derived from it, see Sect. 2.3). The map has been smoothed using a Gaussian of FWHM 1.5 pixels. No astronomical point-like features were detected. In addition, we recovered artificial sources inserted into the raw data at the 5σ contrast level at separations ranging from 100 mas to 3 arcsec with increments of 100 mas (X-shaped pattern of sources). The field of view displayed here is 6.̋25 by 6.̋25. Counts are displayed on linear scale and inverted (dark corresponds to high counts). North is up. The central white dwarf is not visible in this map because of image processing.
Current usage metrics show cumulative count of Article Views (full-text article views including HTML views, PDF and ePub downloads, according to the available data) and Abstracts Views on Vision4Press platform.
Data correspond to usage on the plateform after 2015. The current usage metrics is available 48-96 hours after online publication and is updated daily on week days.
Initial download of the metrics may take a while.