Fig. 5
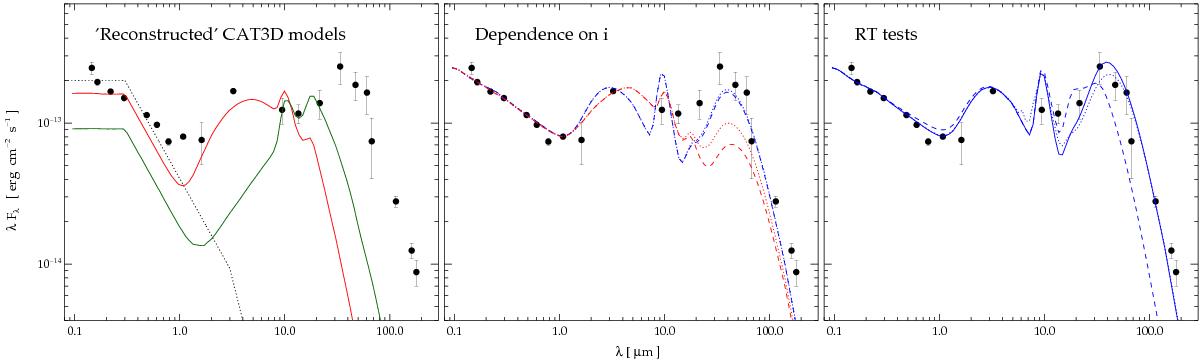
Left panel: reconstructed full face-on SED of the adopted CAT3D models, adding to the dusty torus SED (red solid line for model B and green solid line for model C) a dust-free view of the Hönig & Kishimoto (2010) intrinsic SED of the accretion disk. The dotted line is the SED of the accretion disk scaled to the observed optical/UV datapoints. Central panel: SEDs for models A (blue) and B (red) using the central source only and adopting two different inclination angles of the polar axis of the torus with respect to that of the host: i = 0 (dashed lines) and 20° (dotted lines). Right panel: SEDs for model A but with dust mass reduced by a factor of 10 (dashed line), and by using the original dust mass but increasing the resolution and adopting a full grain size distribution plus stochastic heating (dotted line). The solid line is the reference model from the left panel of Fig. 4.
Current usage metrics show cumulative count of Article Views (full-text article views including HTML views, PDF and ePub downloads, according to the available data) and Abstracts Views on Vision4Press platform.
Data correspond to usage on the plateform after 2015. The current usage metrics is available 48-96 hours after online publication and is updated daily on week days.
Initial download of the metrics may take a while.