Free Access
Fig. 3
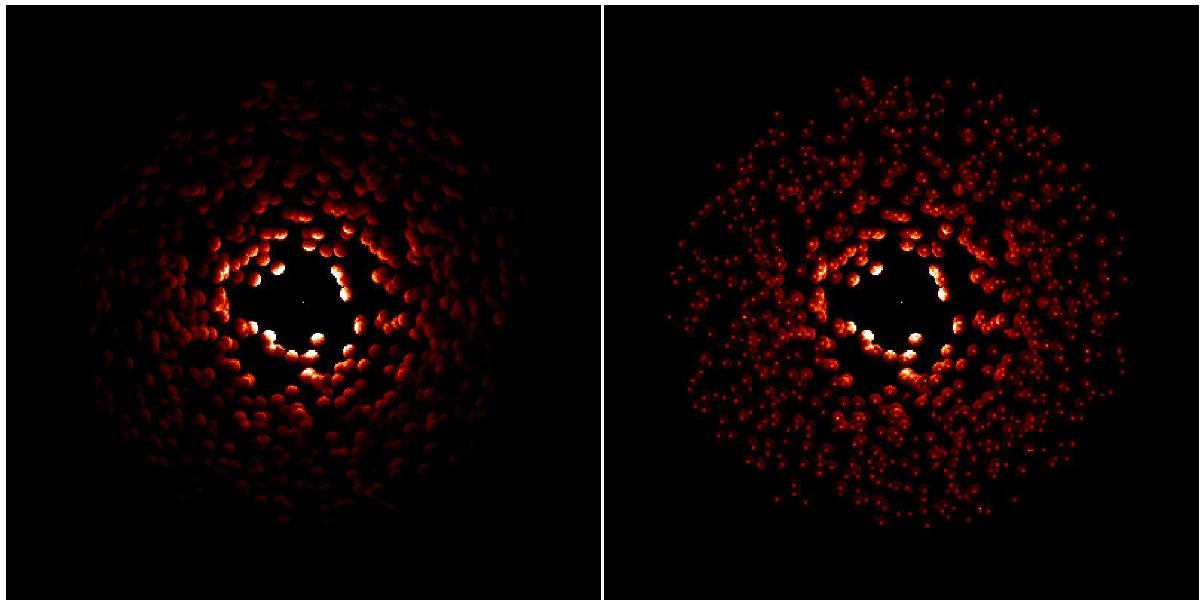
Maps of 7 kpc × 7 kpc regions representing the radiation emitted at 40 μm in the face-on direction for model A. In the left panel the only source of radiation is the central one. The right panel shows the full model where both the central source and the stars embedded in the clouds contribute to dust heating.
Current usage metrics show cumulative count of Article Views (full-text article views including HTML views, PDF and ePub downloads, according to the available data) and Abstracts Views on Vision4Press platform.
Data correspond to usage on the plateform after 2015. The current usage metrics is available 48-96 hours after online publication and is updated daily on week days.
Initial download of the metrics may take a while.