Fig. 6
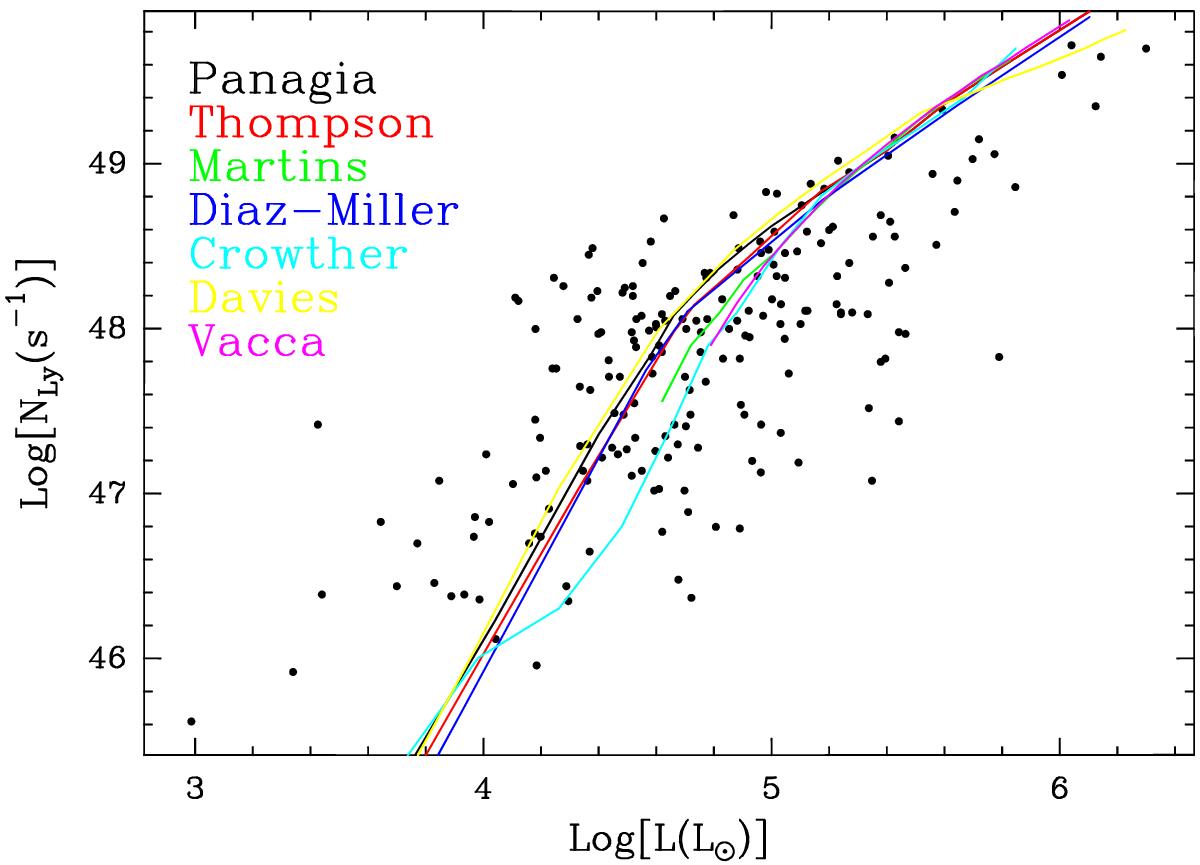
Same as Fig. 5, where the relationships between NLy and L for a single ZAMS star obtained by various authors (Panagia 1973; Thompson 1984; Martins et al. 2005; Diaz-Miller et al. 1998; Davies et al. 2011; Vacca et al. 1996; Crowther 2005) are plotted. Clearly, in all cases the number of sources lying in the forbidden region above these curves is large.
Current usage metrics show cumulative count of Article Views (full-text article views including HTML views, PDF and ePub downloads, according to the available data) and Abstracts Views on Vision4Press platform.
Data correspond to usage on the plateform after 2015. The current usage metrics is available 48-96 hours after online publication and is updated daily on week days.
Initial download of the metrics may take a while.