Fig. 5
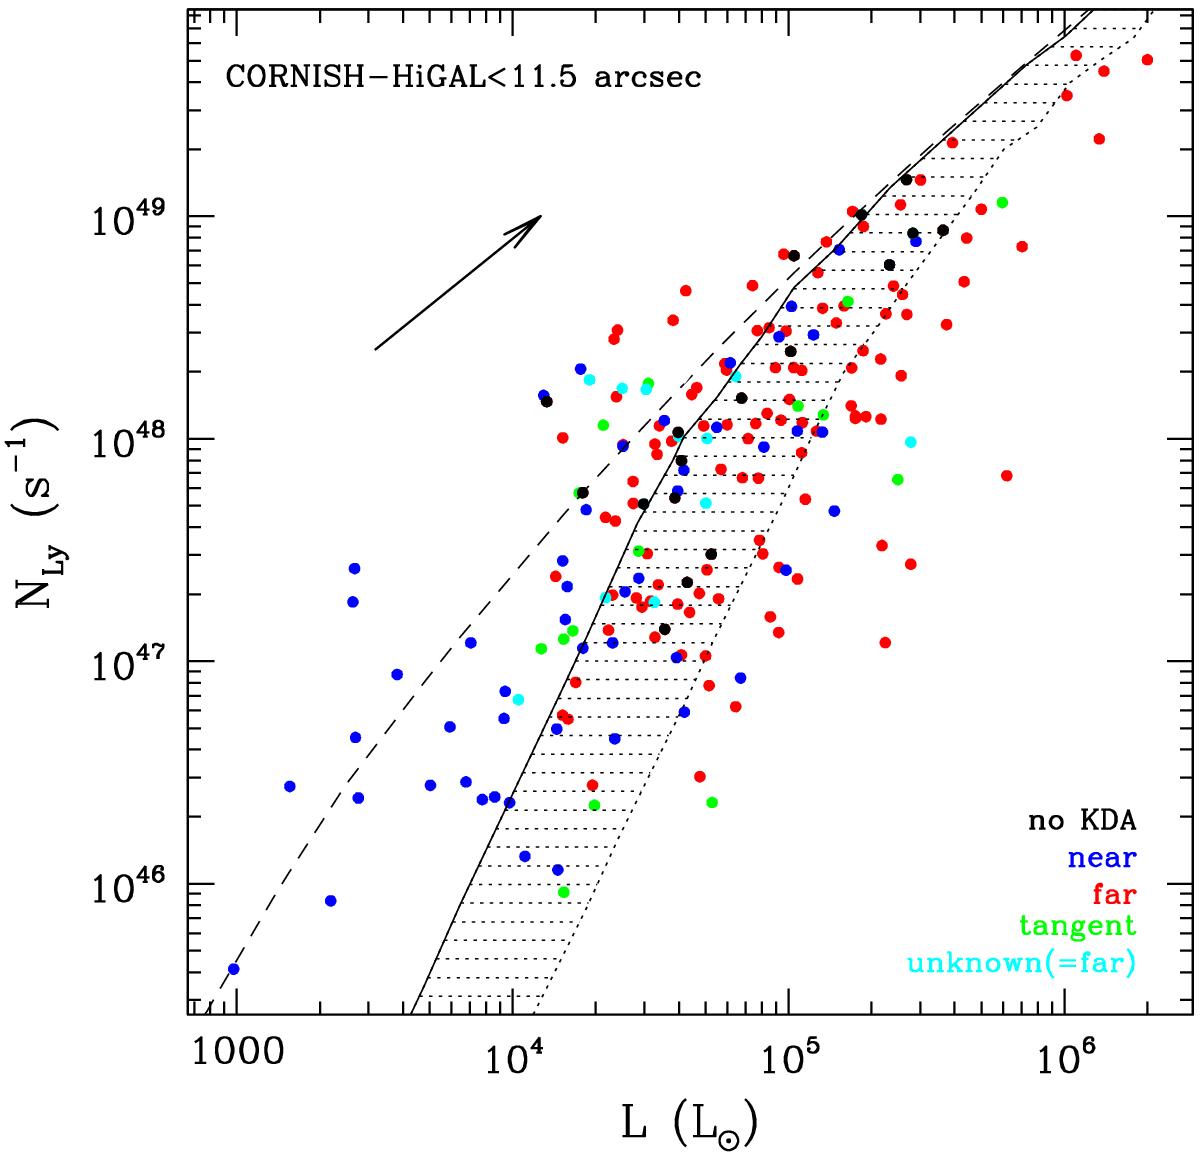
Lyman continuum of the selected sample of CORNISH Hii regions versus the corresponding bolometric luminosity obtained from the Hi-GAL data. The color of the symbols indicates the choice of the kinematic distance: blue for near, red for far, green for tangent point, cyan for unknown (in this case the far distance was assumed), and black for no KDA. The arrow indicates how much a point would move if its distance is increased by a factor of 2. The solid curve corresponds to the NLy–L relationship for a ZAMS star, while the hatched area is where 90% of the simulated stellar clusters should lie. We note the large number of sources in the forbidden region above the solid curve. The dashed curve is the NLy that a star would emit if it were a perfect blackbody.
Current usage metrics show cumulative count of Article Views (full-text article views including HTML views, PDF and ePub downloads, according to the available data) and Abstracts Views on Vision4Press platform.
Data correspond to usage on the plateform after 2015. The current usage metrics is available 48-96 hours after online publication and is updated daily on week days.
Initial download of the metrics may take a while.