Fig. 2
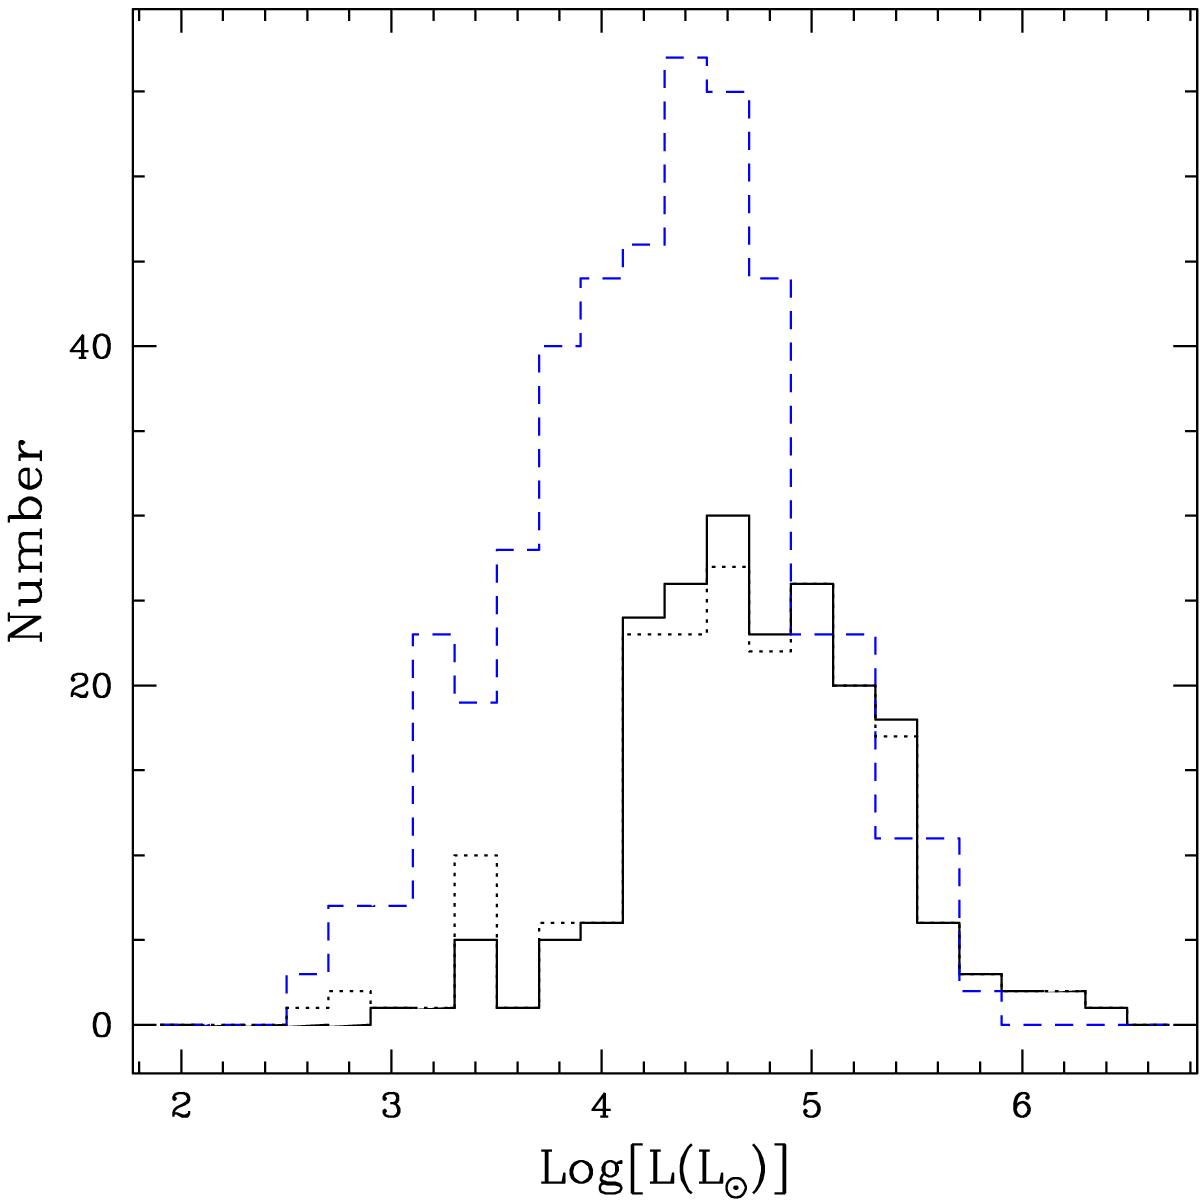
Distribution of the luminosities of CORNISH Hii regions. The solid and dotted histograms are obtained by choosing, respectively, the far and near distances for the 11 targets for which the KDA could not be solved. For the sake of comparison, the distribution of the Hii regions from the rms survey taken from Fig. 1 in Mottram et al. (2011) is also shown (blue dashed histogram).
Current usage metrics show cumulative count of Article Views (full-text article views including HTML views, PDF and ePub downloads, according to the available data) and Abstracts Views on Vision4Press platform.
Data correspond to usage on the plateform after 2015. The current usage metrics is available 48-96 hours after online publication and is updated daily on week days.
Initial download of the metrics may take a while.