Free Access
Fig. 16
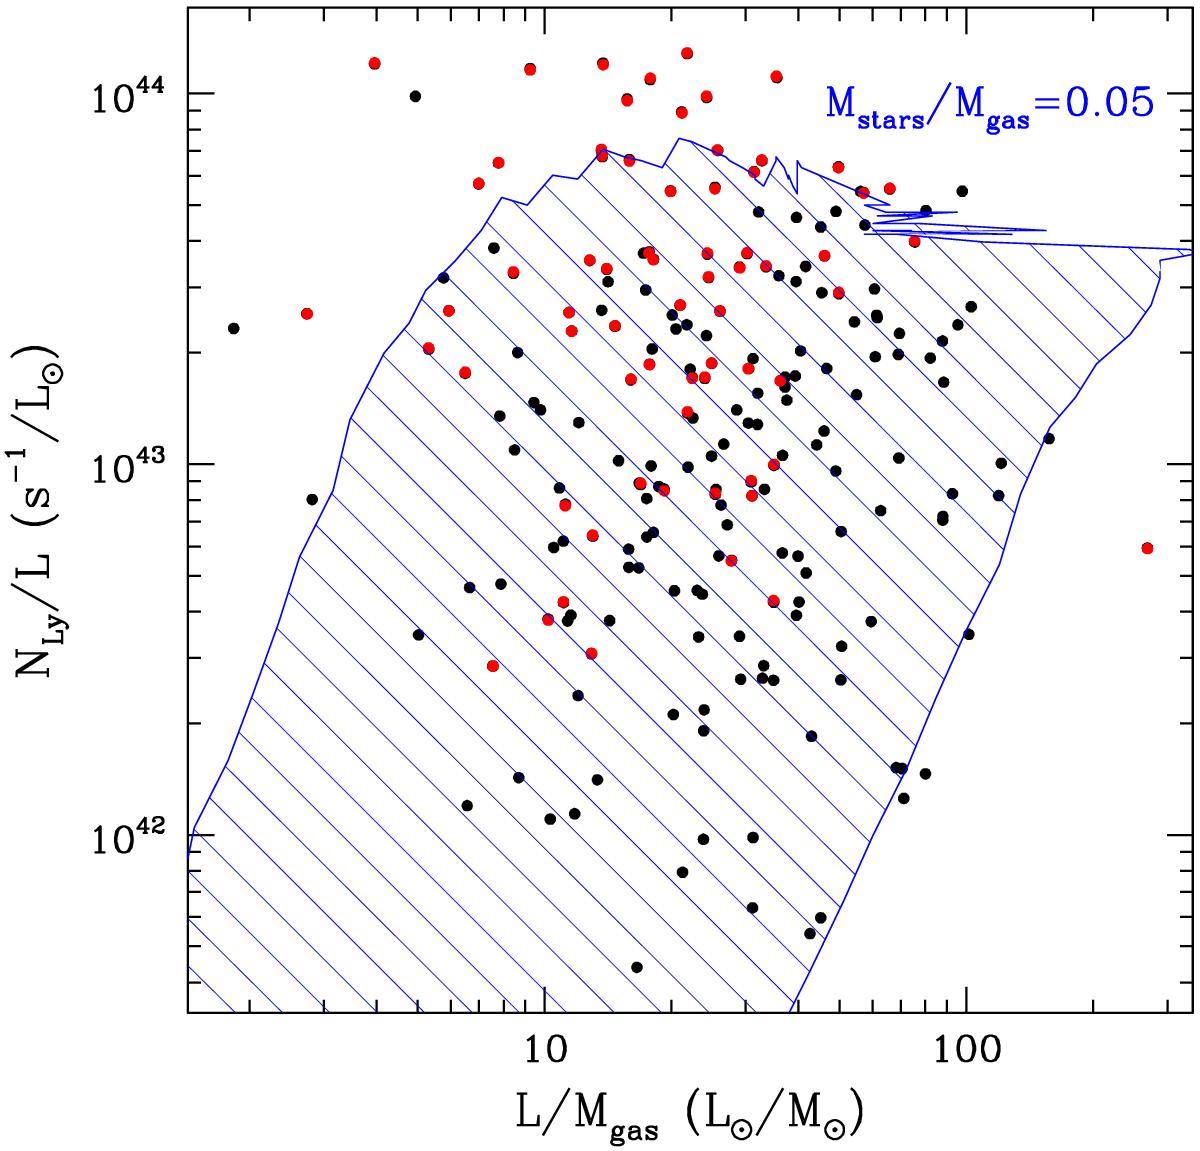
Ratio between the Lyman continuum photon rate and the bolometric luminosity, versus the ratio between the luminosity and the clump mass for the CORNISH Hii regions. The red points indicate sources with Lyman excess. The hatched area contains 90% of the simulated clusters assuming a star formation efficiency of 5%.
Current usage metrics show cumulative count of Article Views (full-text article views including HTML views, PDF and ePub downloads, according to the available data) and Abstracts Views on Vision4Press platform.
Data correspond to usage on the plateform after 2015. The current usage metrics is available 48-96 hours after online publication and is updated daily on week days.
Initial download of the metrics may take a while.