Free Access
Fig. 14
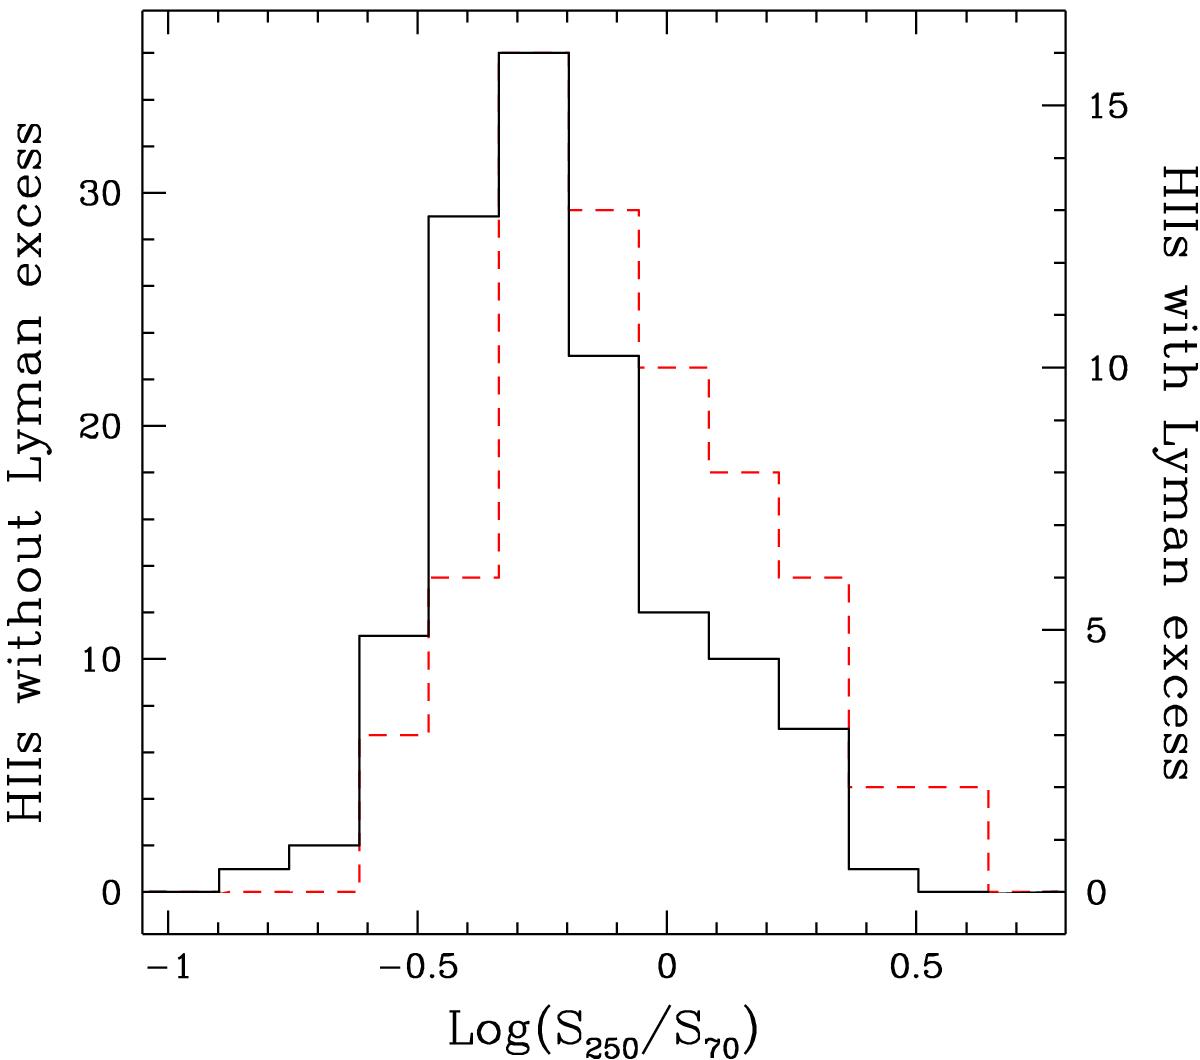
Distribution of the color index between 250 μm and 70 μm for the sources with Lyman excess (dashed histogram, labels on right axis) and without (solid histogram, labels on left axis). We note how the latter is skewed towards lower color indices with respect to the former.
Current usage metrics show cumulative count of Article Views (full-text article views including HTML views, PDF and ePub downloads, according to the available data) and Abstracts Views on Vision4Press platform.
Data correspond to usage on the plateform after 2015. The current usage metrics is available 48-96 hours after online publication and is updated daily on week days.
Initial download of the metrics may take a while.