Free Access
Fig. 13
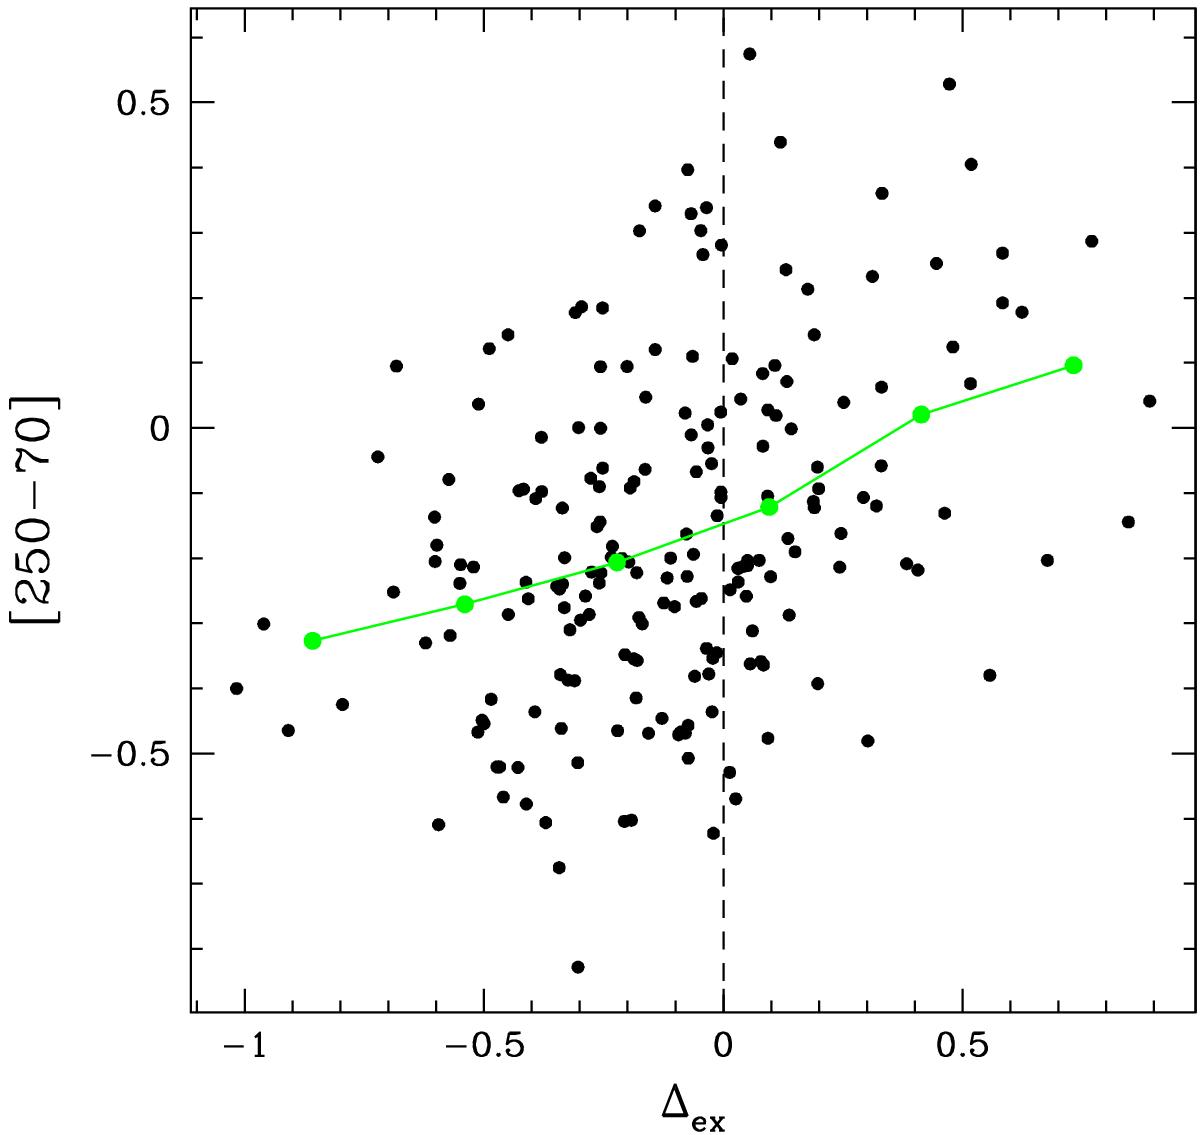
Color index between 250 μm and 70 μm versus the parameter Δex measuring the Lyman excess, defined in Eq. (2). The vertical dashed line marks the separation between sources with Lyman excess (i.e., with Δex> 0) and those without. The solid line connects points obtained after rebinning the data.
Current usage metrics show cumulative count of Article Views (full-text article views including HTML views, PDF and ePub downloads, according to the available data) and Abstracts Views on Vision4Press platform.
Data correspond to usage on the plateform after 2015. The current usage metrics is available 48-96 hours after online publication and is updated daily on week days.
Initial download of the metrics may take a while.