Fig. 1
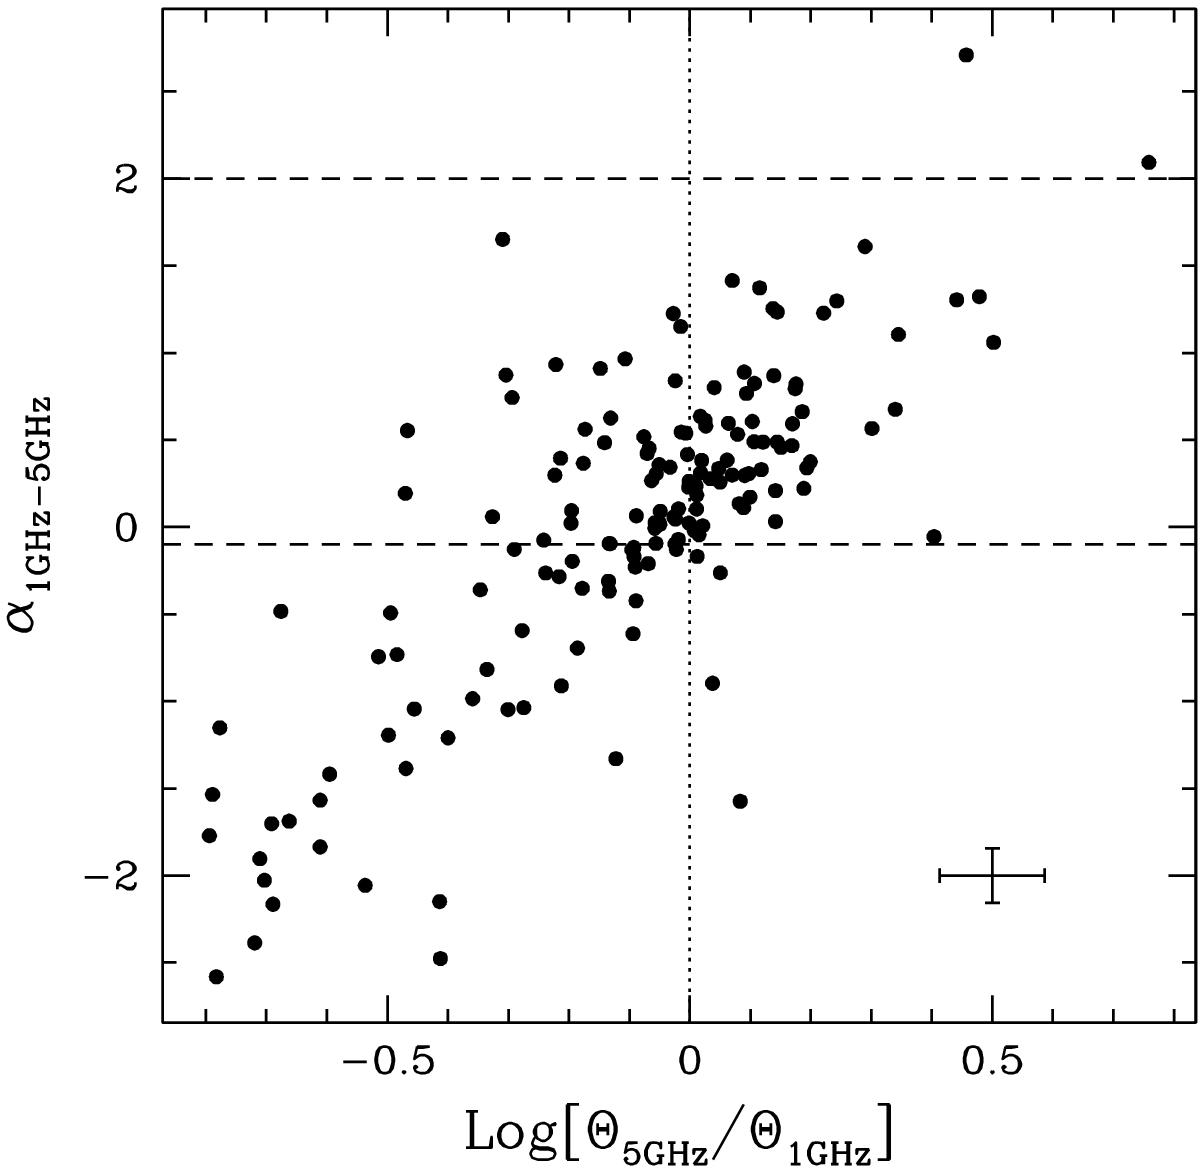
Spectral index between 1.4 GHz and 5 GHz of our sample of Hii regions versus the ratio between the corresponding angular sizes. The horizontal dashed lines bracket the range of spectral indices expected for free-free continuum emission, while the dotted vertical line corresponds to equal angular sizes at the two frequencies. The cross in the bottom right indicates the typical error bars assuming an uncertainty of 10% at both frequencies, for both the flux density and the size.
Current usage metrics show cumulative count of Article Views (full-text article views including HTML views, PDF and ePub downloads, according to the available data) and Abstracts Views on Vision4Press platform.
Data correspond to usage on the plateform after 2015. The current usage metrics is available 48-96 hours after online publication and is updated daily on week days.
Initial download of the metrics may take a while.