Fig. 1
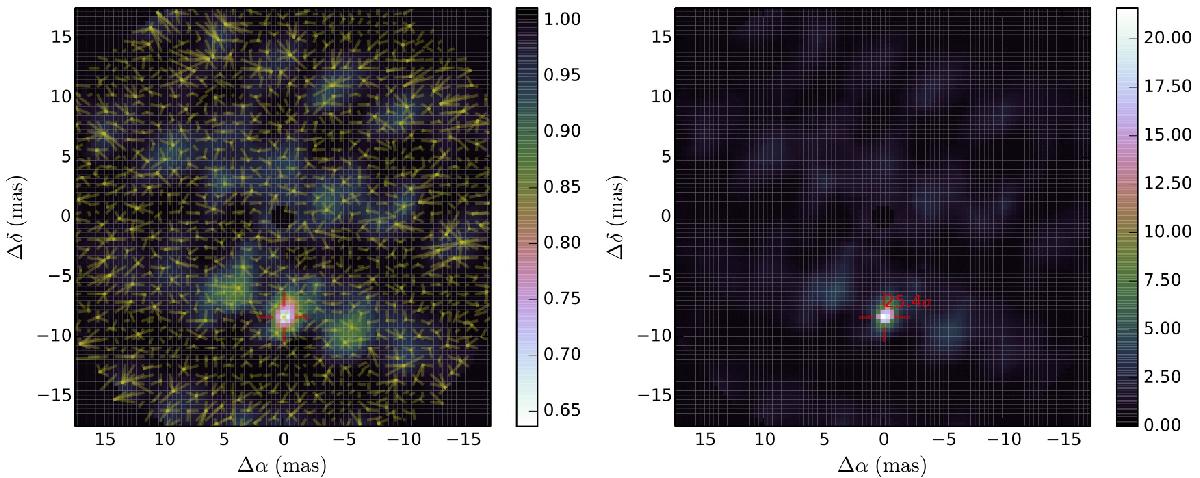
![]() map of the local minima (left) and detection level map (right) of V1334 Cyg for the observations on 2012-10-01. The yellow lines represent the convergence from the starting points to the final fitted position. The maps were reinterpolated in a regular grid for clarity. The axis limit was chosen according to the location of the companion.
map of the local minima (left) and detection level map (right) of V1334 Cyg for the observations on 2012-10-01. The yellow lines represent the convergence from the starting points to the final fitted position. The maps were reinterpolated in a regular grid for clarity. The axis limit was chosen according to the location of the companion.
Current usage metrics show cumulative count of Article Views (full-text article views including HTML views, PDF and ePub downloads, according to the available data) and Abstracts Views on Vision4Press platform.
Data correspond to usage on the plateform after 2015. The current usage metrics is available 48-96 hours after online publication and is updated daily on week days.
Initial download of the metrics may take a while.