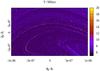
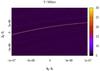
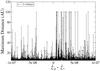
Fig. 4
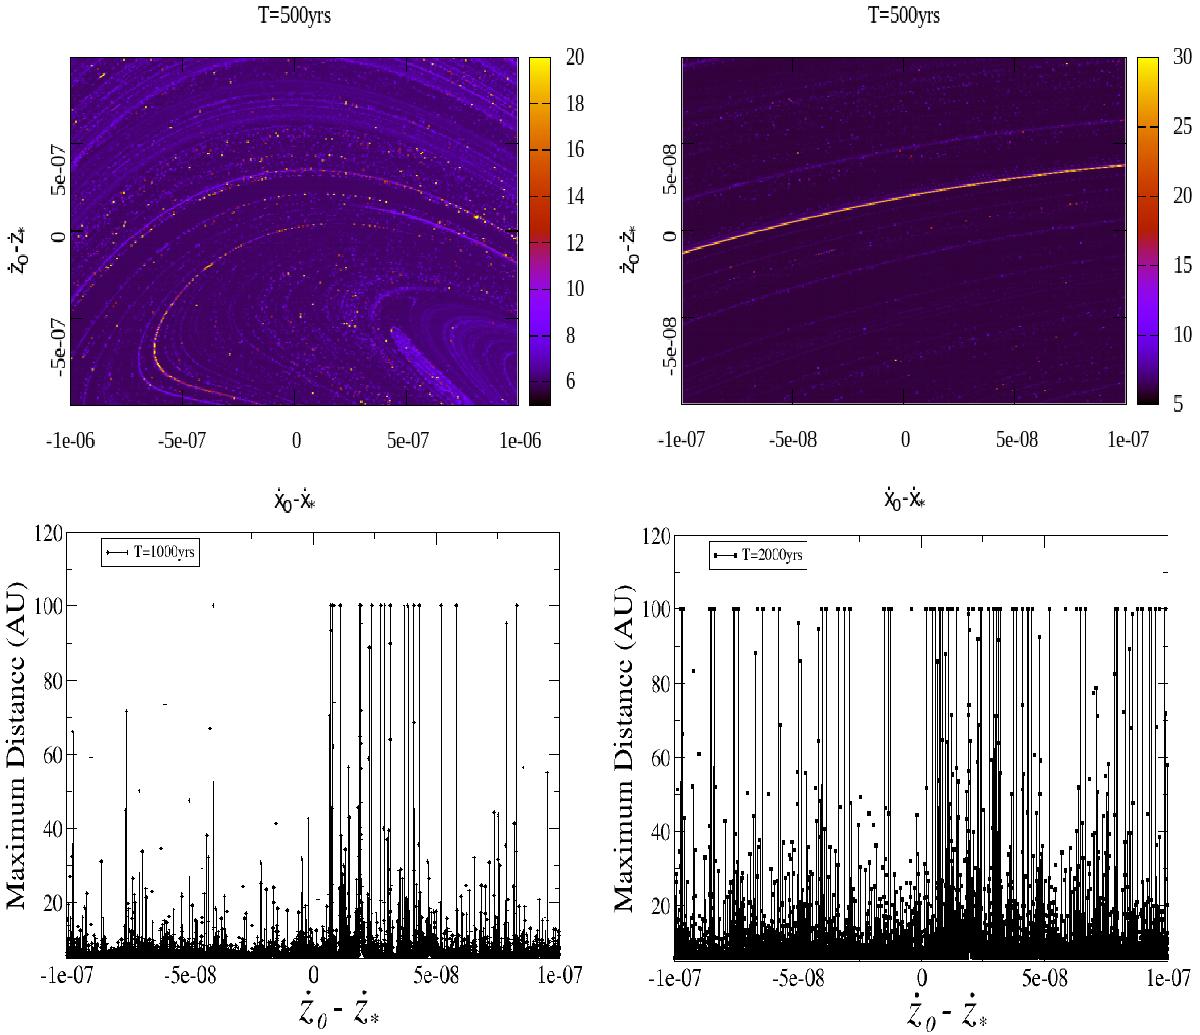
Representation of the maximum distance from the Sun reached in the interval [T,T0] by orbits with initial conditions on a grid of 500 × 500 initial conditions regularly spaced on (ẋ,ż) (the axes in the picture represent (ẋ0−ẋ∗,ż0−ż∗); the other initial conditions are the same as comet 67P), for |T| = 500 yrs (top panels). The colour scale represents the maximum distance, so that yellow means distances larger than 20 AU (top-left panel) or 30 AU (top-right panel). The top-right panel is a zoom-in of the top-left panel. The curves in the pictures are clearly correlated to the ridges of the FLI (see Fig. 1); the topology detected in the zoomed-in picture indicates that we can continue the exploration by fixing the value of ẋ0 = ẋ∗: in the bottom panels we represent the maximum distance from the Sun reached in the interval [T,T0] by 10 000 orbits with all the initial conditions equal to ξ∗, except for ż0, and times T = 1000 (bottom-left panel) and T = 2000 (bottom–right panel).
Current usage metrics show cumulative count of Article Views (full-text article views including HTML views, PDF and ePub downloads, according to the available data) and Abstracts Views on Vision4Press platform.
Data correspond to usage on the plateform after 2015. The current usage metrics is available 48-96 hours after online publication and is updated daily on week days.
Initial download of the metrics may take a while.