Fig. 2
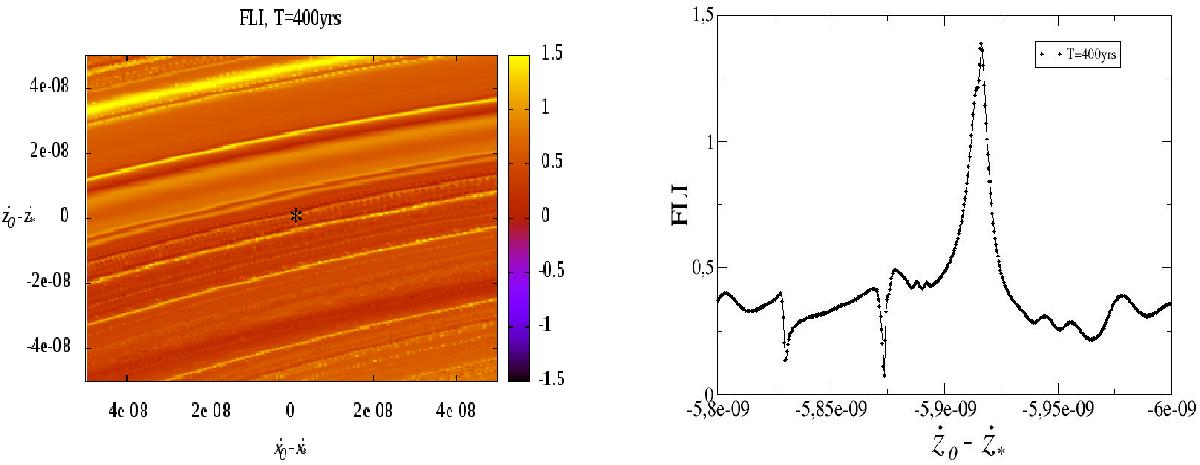
Zooming in on selected ridges of the FLI. In the left panel, we select a faint ridge to zoom in on, marked with an asterisk. Since the ridges are almost parallel to the ẋ axis, we can suitably represent their one-dimensional section by computing again the FLI on many more initial conditions close to the ridge, but having the same value of ẋ. The result of the one-dimensional FLI computation is represented in the right panel: zooming in on the ridge we better detect its amplitude, and initial conditions having deeper encounters. The integration time is |T| = 400 yrs.
Current usage metrics show cumulative count of Article Views (full-text article views including HTML views, PDF and ePub downloads, according to the available data) and Abstracts Views on Vision4Press platform.
Data correspond to usage on the plateform after 2015. The current usage metrics is available 48-96 hours after online publication and is updated daily on week days.
Initial download of the metrics may take a while.