Fig. 1
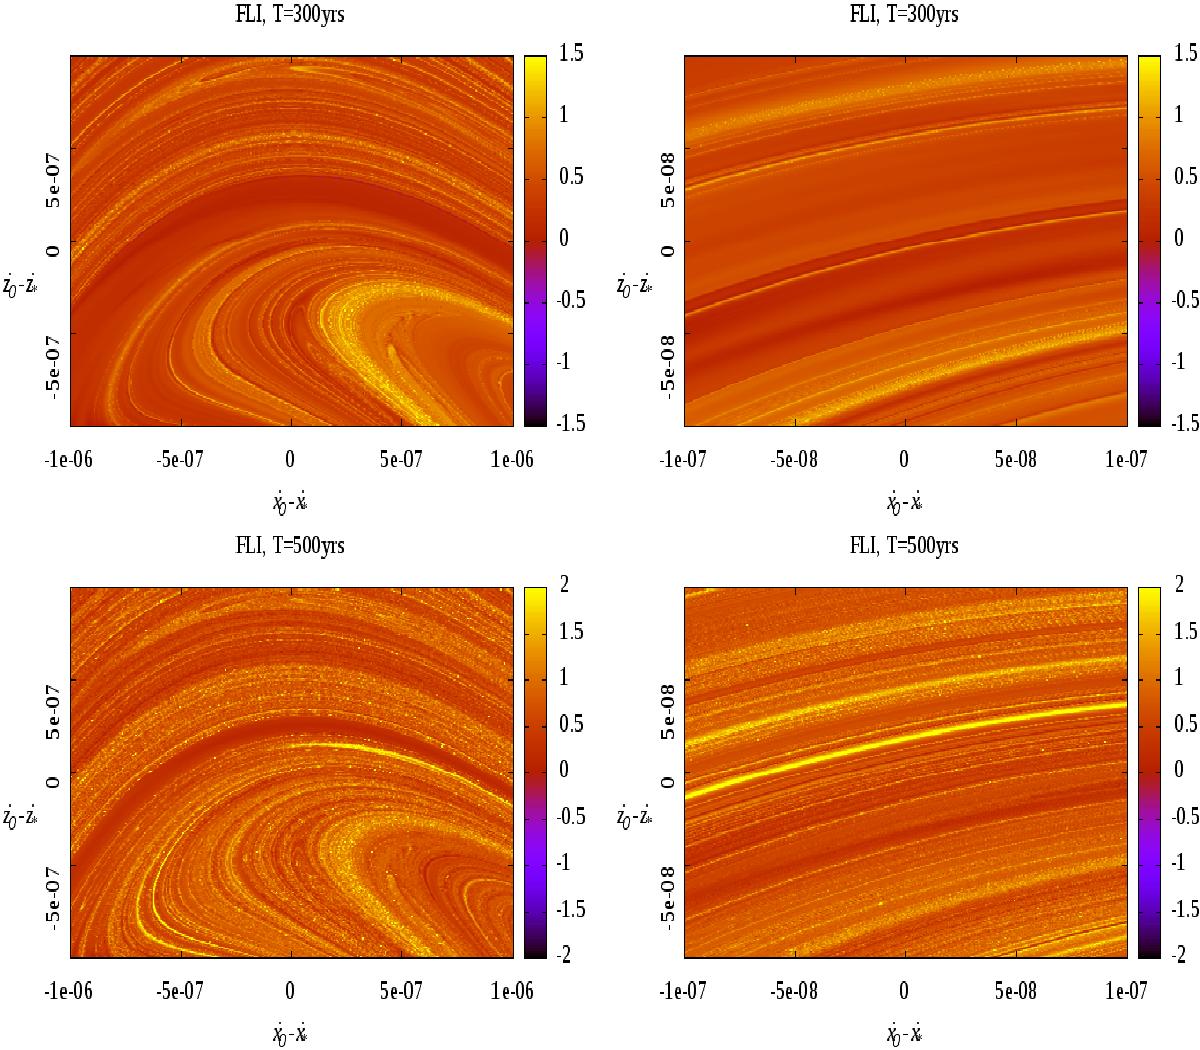
Representation of the FLI (3) computed a grid of 500 × 500 initial conditions regularly spaced on (ẋ,ż) (the axes in the picture represent (ẋ0−ẋ∗,ż0−ż∗); the other initial conditions are x0 = x∗,y0 = y∗,z0 = z∗,ẏ0 = ẏ∗), computed for |T| = 300 yrs (top panels) and |T| = 500 yrs (bottom panels); the left panels are a zoom-in of the right ones. The FLI is reported using a colour scale, such that the highest FLI values are shown in yellow. In this way, the yellow curves in the picture correspond to the ridges of the FLI indicator, and pinpoint the set of initial conditions whose orbits have had past close encounters with Jupiter, in addition to the deep close encounter of 1959.
Current usage metrics show cumulative count of Article Views (full-text article views including HTML views, PDF and ePub downloads, according to the available data) and Abstracts Views on Vision4Press platform.
Data correspond to usage on the plateform after 2015. The current usage metrics is available 48-96 hours after online publication and is updated daily on week days.
Initial download of the metrics may take a while.