Fig. 4
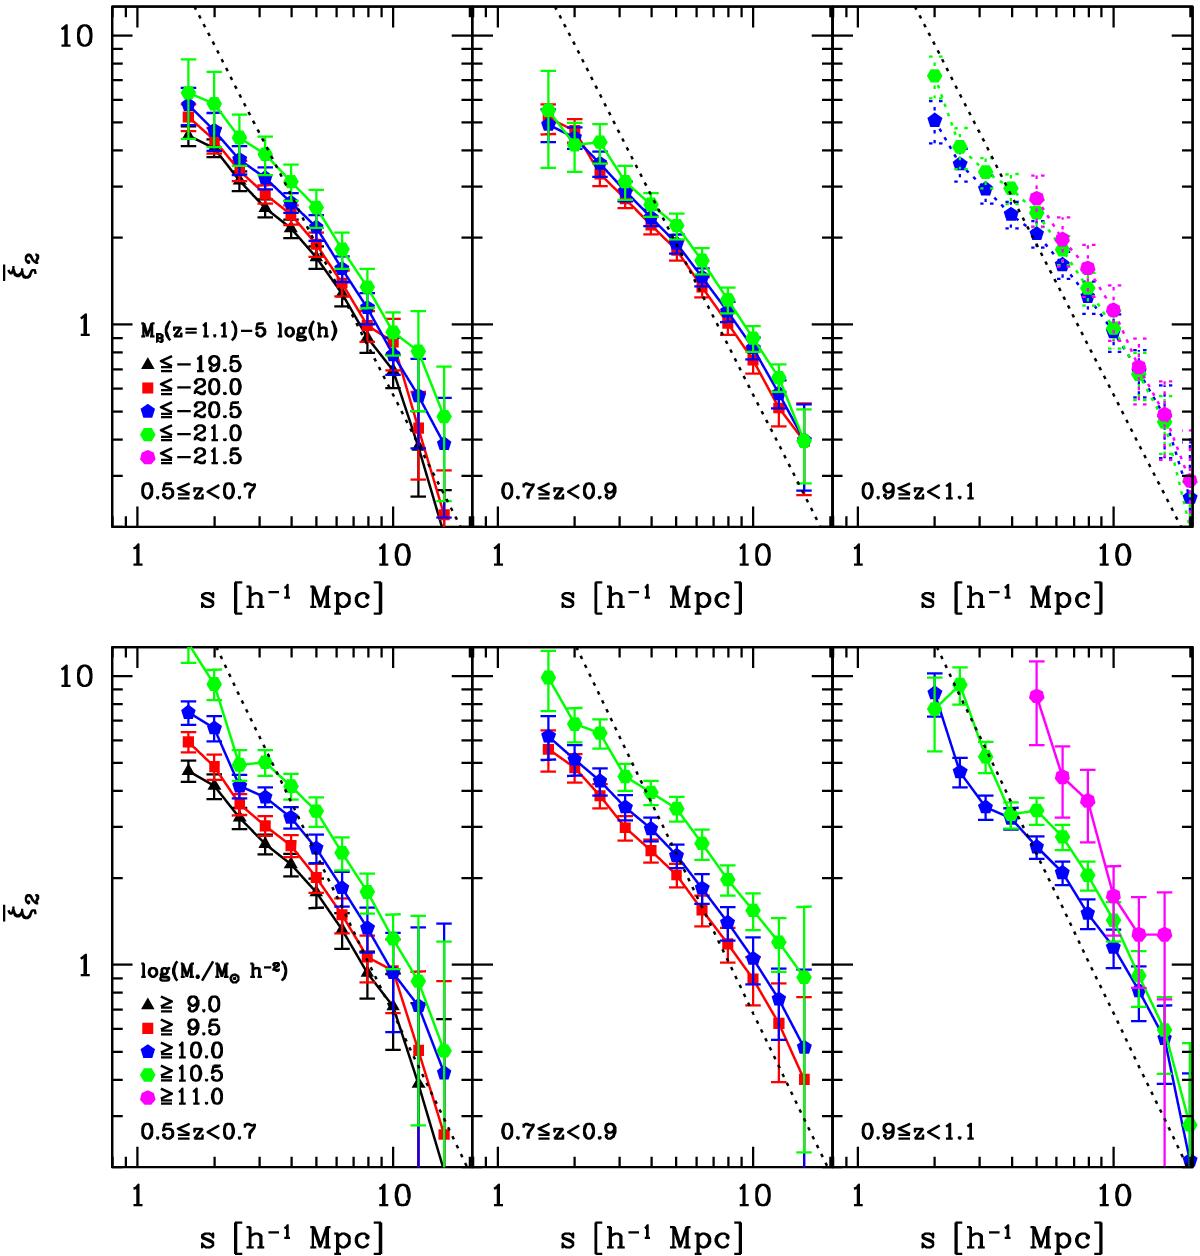
Volume-averaged two-point correlation functions ![]() as a function of the B absolute luminosity (upper panels) and stellar mass (lower panels). The limits of the subsamples in absolute magnitude and stellar mass are shown in the left upper and lower panels. Black triangles: MB(z = 1.1) − 5log (h) ≤ −19.5 (log (M∗/M⊙h-2 ≥ 9.0 M⊙); red squares: MB(z = 1.1) − 5log (h) ≤ −20.0 (log (M∗/M⊙h-2 ≥ 9.5 M⊙); blue pentagons: MB(z = 1.1) − 5log (h) ≤ −20.5 (log (M∗/M⊙h-2 ≥ 10.0 M⊙); green hexagons: MB(z = 1.1) − 5log (h) ≤ −21.0 (log (M∗/M⊙h-2 ≥ 10.5 M⊙); magenta heptagons: MB(z = 1.1) − 5log (h) ≤ −21.5 (log (M∗/M⊙h-2 ≥ 11.0 M⊙). Dotted lines: real-space
as a function of the B absolute luminosity (upper panels) and stellar mass (lower panels). The limits of the subsamples in absolute magnitude and stellar mass are shown in the left upper and lower panels. Black triangles: MB(z = 1.1) − 5log (h) ≤ −19.5 (log (M∗/M⊙h-2 ≥ 9.0 M⊙); red squares: MB(z = 1.1) − 5log (h) ≤ −20.0 (log (M∗/M⊙h-2 ≥ 9.5 M⊙); blue pentagons: MB(z = 1.1) − 5log (h) ≤ −20.5 (log (M∗/M⊙h-2 ≥ 10.0 M⊙); green hexagons: MB(z = 1.1) − 5log (h) ≤ −21.0 (log (M∗/M⊙h-2 ≥ 10.5 M⊙); magenta heptagons: MB(z = 1.1) − 5log (h) ≤ −21.5 (log (M∗/M⊙h-2 ≥ 11.0 M⊙). Dotted lines: real-space ![]() for the MB(z = 1.1) − 5log (h) ≤ −20.5 (log (M∗/M⊙h-2 ≥ 10.0 M⊙) subsamples in the redshift bin [0.5, 0.7], predicted from the power-law fit of ξ2 in Marulli et al. (2013).
for the MB(z = 1.1) − 5log (h) ≤ −20.5 (log (M∗/M⊙h-2 ≥ 10.0 M⊙) subsamples in the redshift bin [0.5, 0.7], predicted from the power-law fit of ξ2 in Marulli et al. (2013).
Current usage metrics show cumulative count of Article Views (full-text article views including HTML views, PDF and ePub downloads, according to the available data) and Abstracts Views on Vision4Press platform.
Data correspond to usage on the plateform after 2015. The current usage metrics is available 48-96 hours after online publication and is updated daily on week days.
Initial download of the metrics may take a while.