Fig. 2
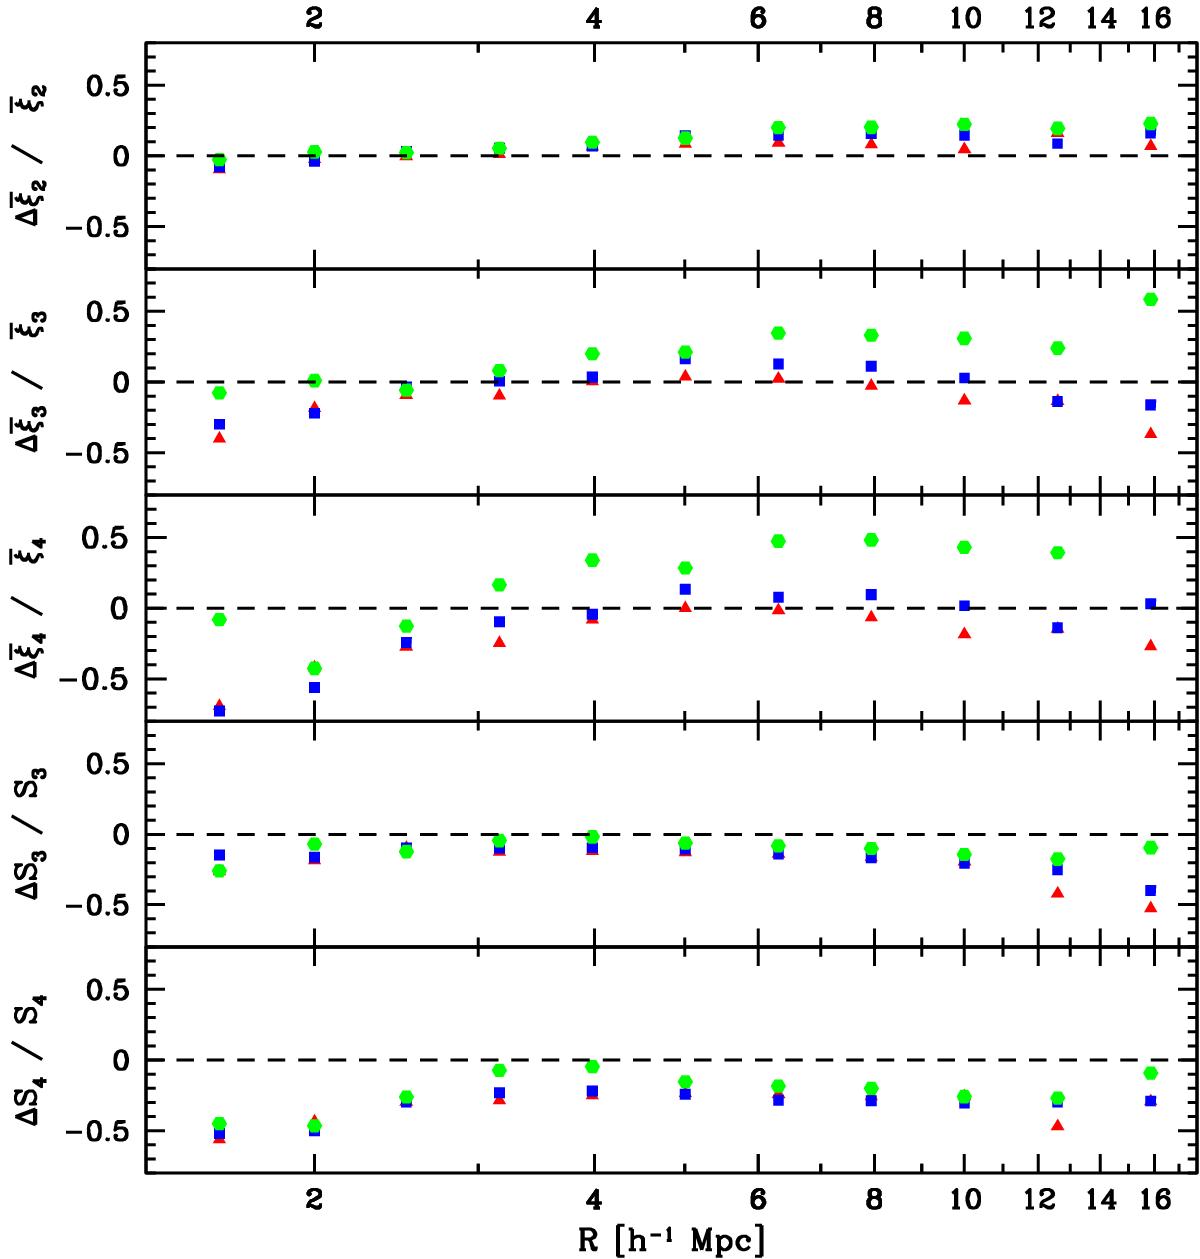
Fractional difference of the average ![]() ,
, ![]() ,
, ![]() , S3 and S4 (from top to bottom) for the same set of mock catalogues as defined in Fig. 1, i.e. with 100% sampling rate and without gaps, and with sampling rate and gaps as in VIPERS. The subsamples are limited at MB(z = 1.1) − 5log (h) ≤ −20.5. Red triangles: 0.5 ≤ z< 0.7; blue squares: 0.7 ≤ z< 0.9; green hexagons: 0.9 ≤ z< 1.1.
, S3 and S4 (from top to bottom) for the same set of mock catalogues as defined in Fig. 1, i.e. with 100% sampling rate and without gaps, and with sampling rate and gaps as in VIPERS. The subsamples are limited at MB(z = 1.1) − 5log (h) ≤ −20.5. Red triangles: 0.5 ≤ z< 0.7; blue squares: 0.7 ≤ z< 0.9; green hexagons: 0.9 ≤ z< 1.1.
Current usage metrics show cumulative count of Article Views (full-text article views including HTML views, PDF and ePub downloads, according to the available data) and Abstracts Views on Vision4Press platform.
Data correspond to usage on the plateform after 2015. The current usage metrics is available 48-96 hours after online publication and is updated daily on week days.
Initial download of the metrics may take a while.