Free Access
Fig. 13
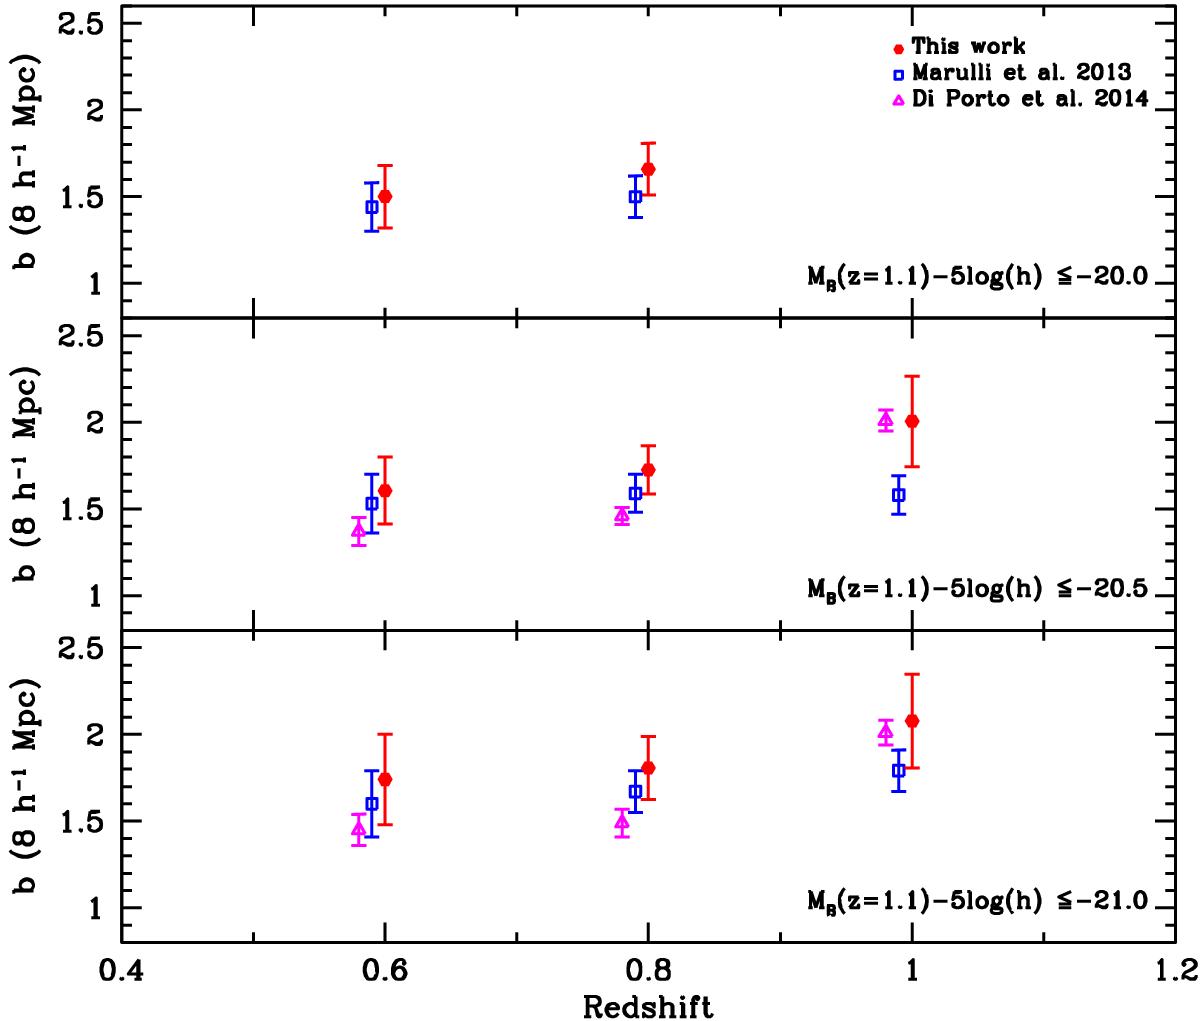
Linear bias b as a function of redshift. Top panel: MB ≤ −20.0(z = 1.1) + 5log (h); middle panel: MB ≤ −20.5(z = 1.1) + 5log (h); bottom panel: MB ≤ −21.0(z = 1.1) + 5log (h). Red hexagons: our estimates of b = σ8g/σ8m. Blue squares: estimates of Marulli et al. (2013). Magenta triangles: Di Porto et al. (2014).
Current usage metrics show cumulative count of Article Views (full-text article views including HTML views, PDF and ePub downloads, according to the available data) and Abstracts Views on Vision4Press platform.
Data correspond to usage on the plateform after 2015. The current usage metrics is available 48-96 hours after online publication and is updated daily on week days.
Initial download of the metrics may take a while.